
Postcard Parks
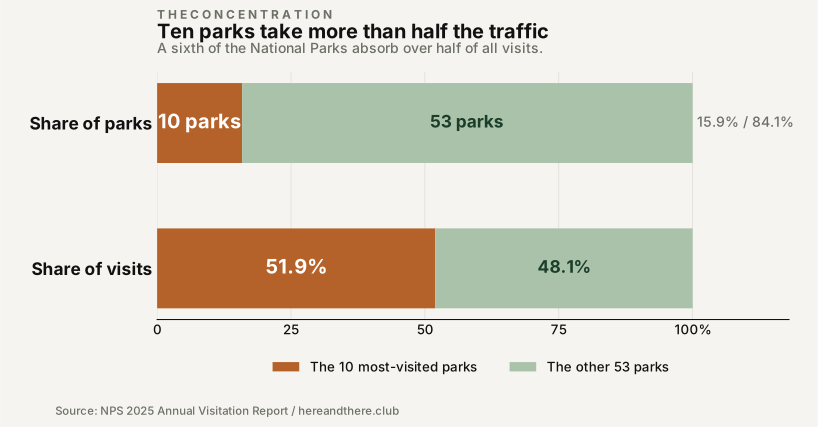
The United States has 63 places that carry the full title of National Park. In 2025, ten of them absorbed 51.9% of every recreation visit logged across all of them, and one park took 12.3% by itself. The other 53 split what was left.
- 51.9%
- Ten parks' share of all visits
- 12.3%
- Great Smoky Mountains alone
- 5.7×
- A top-ten park vs the rest
- 7,786
- Visits to the least-visited park
There are 63 places in America that carry the full title of National Park. The crowds do not spread across them evenly. They pile onto ten.
Ten parks take more than half the traffic.
The National Park System logged more than 323 million recreation visits in 2025. Strip out the parkways, monuments, recreation areas and historic sites, and you are left with the 63 units that actually carry the title National Park. Together they drew 93.9 million recreation visits.
Ten of those 63 parks accounted for 51.9% of the total - 48.8 million out of 93.9 million. The other 53 parks divided the remaining 48.1%. Ten parks are 15.9% of the roster and more than half the crowd.
The ten are the names on every postcard.
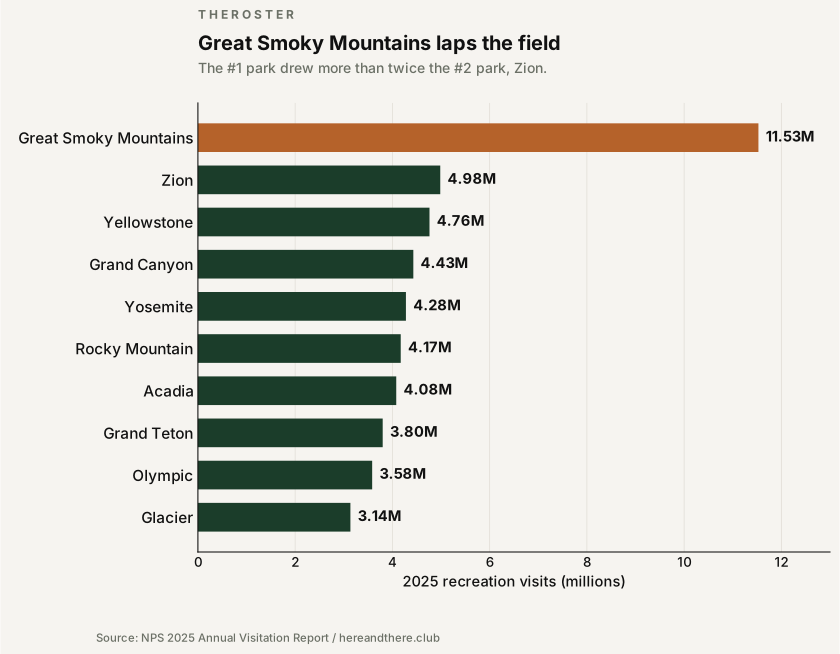
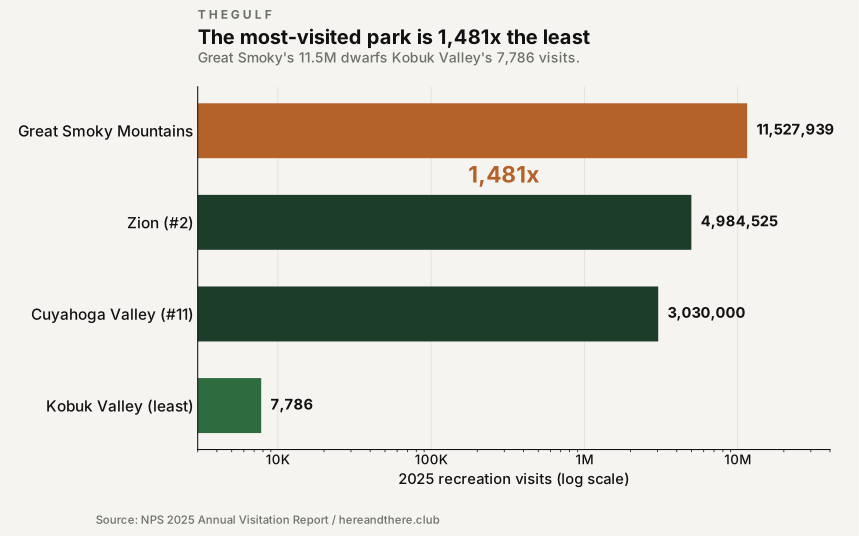
Great Smoky Mountains, Zion, Yellowstone, Grand Canyon, Yosemite, Rocky Mountain, Acadia, Grand Teton, Olympic, Glacier. Great Smoky led with 11,527,939 visits - 11.5 million. Zion followed at 4.98 million and Yellowstone at 4.76 million.
The gap between the first park and the second is larger than the entire annual attendance of most parks in the system.
Half of all visits arrive before the eleventh park.
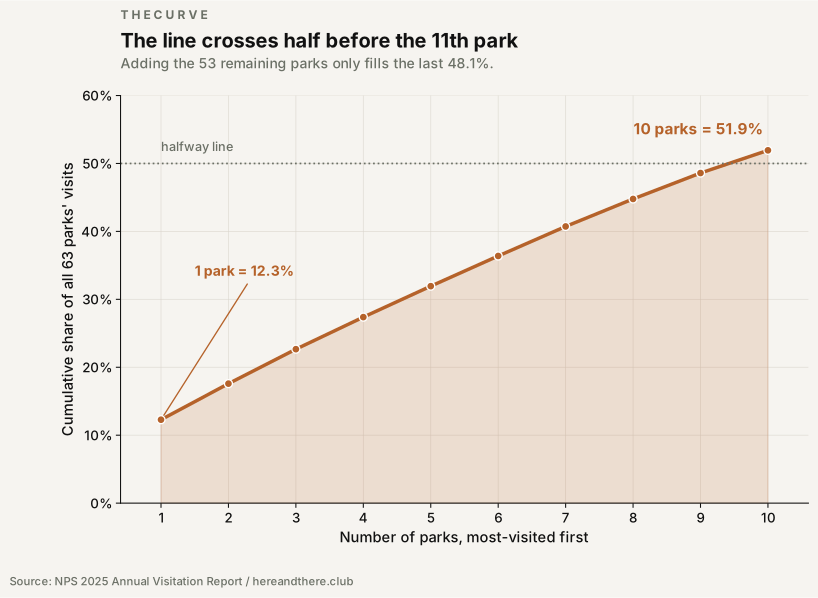
Rank the 63 parks and add them one at a time. The first park alone - Great Smoky - is 12.3% of all National Park visits. By the fifth park the running total reaches 31.9%. By the tenth, 51.9%. Adding all 53 remaining parks fills only the last 48.1%.
Concentration this steep is the signature of a system where a handful of destinations define the public imagination.
Ten parks are 15.9% of the roster and more than half the crowd.
Great Smoky Mountains is 12.3% of every National Park visit.
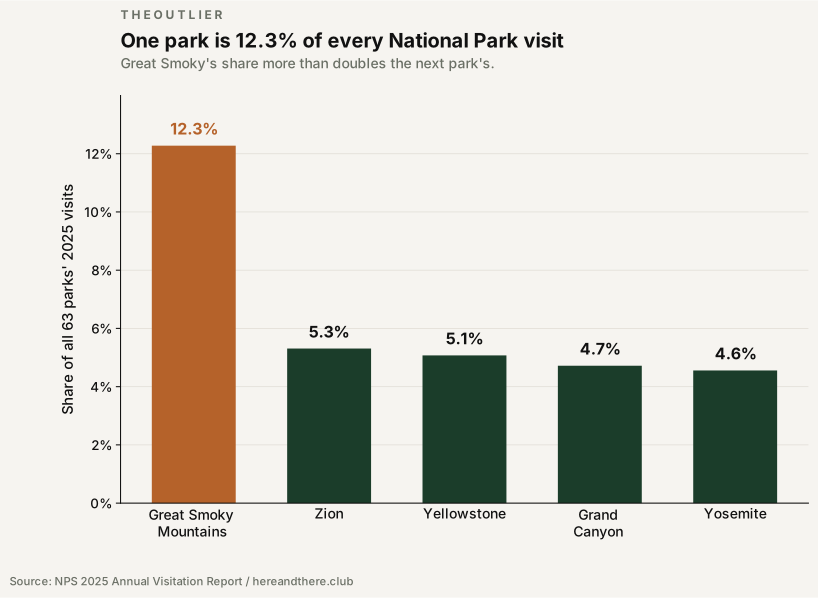
One park does more than the concentration alone suggests. Great Smoky drew 12.3% of all 63 parks' visits in 2025 - more than double the share of second-place Zion (5.3%).
Part of that is structural. Great Smoky charges no entrance fee, and a US highway runs straight through it, so its counter picks up pass-through traffic that a gated park never records. The counting method flatters the number. But even discounted, the park sits alone at the top: its 11.5 million visits are a category of one.
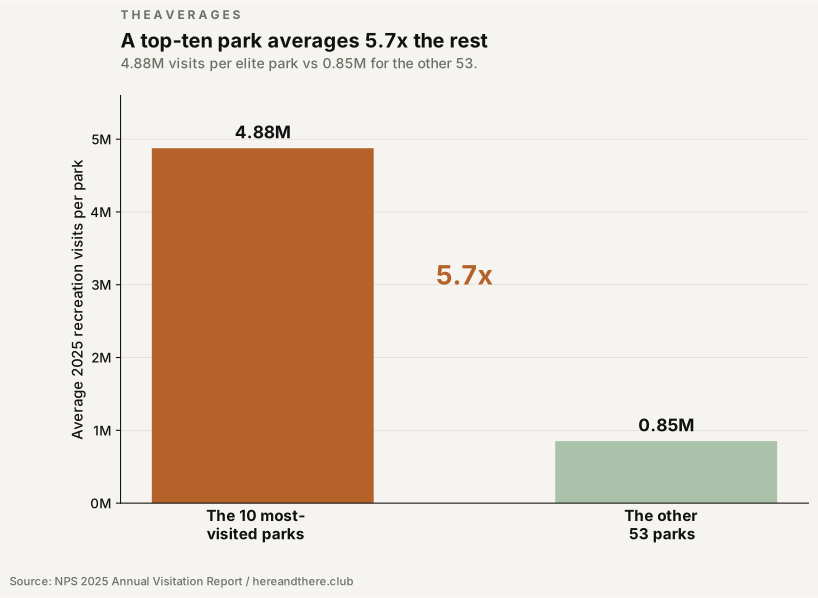
A top-ten park draws 5.7 times the rest.
Average the two groups. Each of the ten most-visited parks pulled 4.88 million recreation visits in 2025. Each of the other 53 averaged 0.85 million. The typical elite park is 5.7 times the size of the typical everything-else park.
That ratio is the shuttle line at Zion and the empty trailhead at Great Basin, in one number.
Fifty-three parks are waiting.
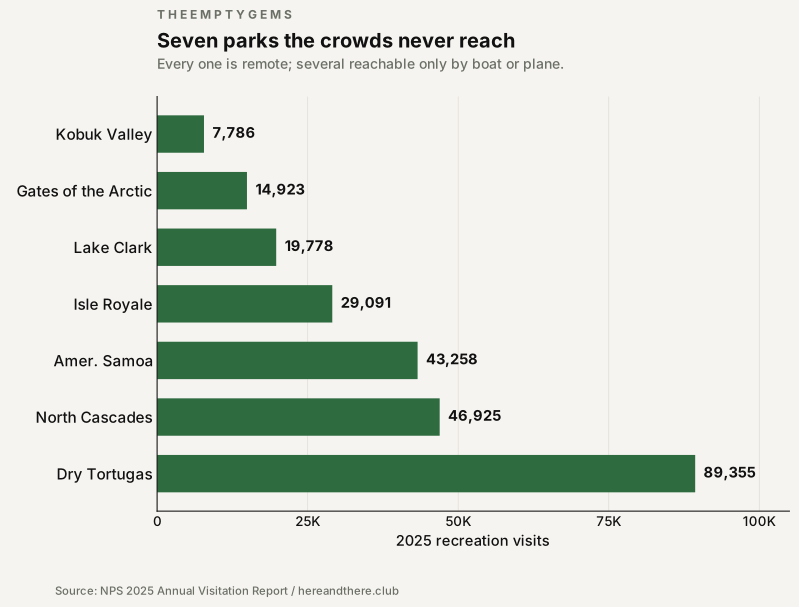
The flip side of concentration is opportunity. The least-visited National Park in 2025 was Kobuk Valley, in Arctic Alaska, with 7,786 recreation visits for the entire year. Gates of the Arctic drew 14,923 and Lake Clark 19,778. Isle Royale, the least-visited park in the Lower 48, drew 29,091. Even Dry Tortugas, off the Florida Keys, logged just 89,355.
These are not lesser landscapes. They are harder to reach - most only by boat or seaplane - and that friction is the whole point. Solitude is the amenity.
The map is more forgiving than the postcard.
Great Smoky Mountains drew 1,481 times as many visitors as Kobuk Valley in 2025. Same designation, same brochure, the same act of Congress standing behind them. The difference between them reflects everything from highways to runways.
The concentration is not a mystery. The ten most famous parks are famous, and fame compounds. So do the highways, airports, and lodges that grow up around a famous park. But the data is also a travel itinerary in disguise. Fifty-three parks split less than half the traffic. The line you are standing in at Yosemite has an alternative, and it draws 7,786 visitors a year.
America does not have a shortage of National Parks. It has a surplus of visitors choosing the same ten.