
Cooler Heads
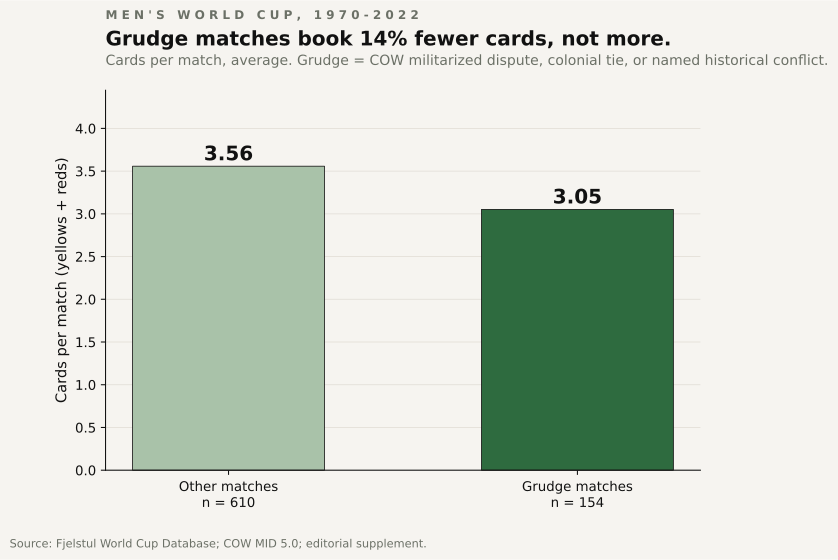
Fifty-two years of men's World Cup bookings, every yellow and every red, tested against every grudge the two flags brought with them. The bar bet says historical conflict means hotter matches. Across 764 matches, grudge pairs booked fewer cards, not more.
- -14%
- Cards per grudge match vs other
- 764
- Men's World Cup matches, 1970-2022
- All 6
- Decades grudge sits below baseline
- 1 of 10
- Top card-fests that are grudge matches
The conventional wisdom is loud, and it travels well. When two countries with real-world bad blood meet on a pitch, the cards are supposed to come out. We checked.
The grudge premium is negative.
We pulled every men's World Cup match from 1970 to 2022. 764 games, 2,640 bookings. We joined the matches to the Correlates of War Militarized Interstate Disputes dataset, to a hand-curated list of former colonizer-and-colonized pairs, and to an editorial supplement covering Cold War blocs, partitioned states, and named regional wars. A pair counts as a grudge if it carries a war-level MID with recorded fatalities, on opposite sides, that started before the match - or sits in the colonial or editorial supplements. Formal-only declarations and threat-only incidents do not flag a pair. One hundred and fifty-four matches qualify.
They average 3.05 cards per match. The other 610 matches average 3.56. Grudge matches are fourteen percent calmer, not hotter.
Pick a decade. Same answer.
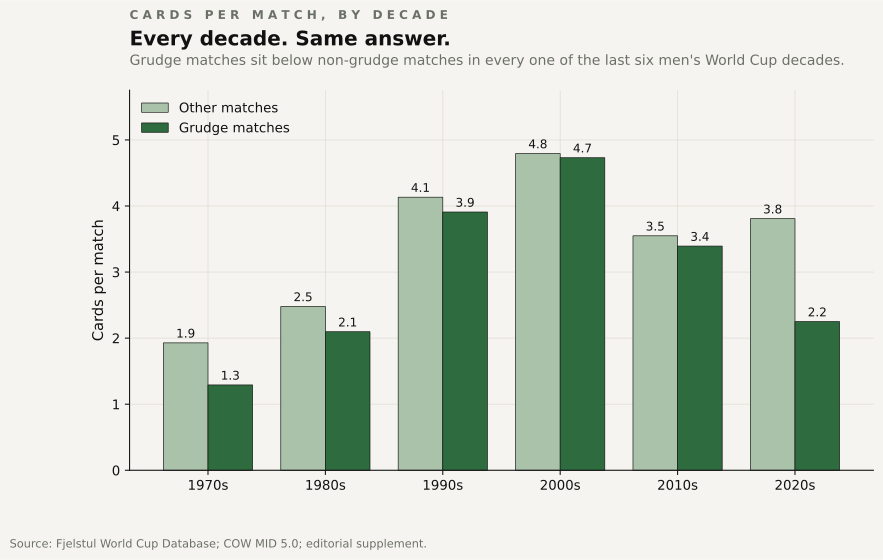
You might think the headline is a Cold War artifact. USA versus Soviet types of pairs do not exist anymore, and what is left of the grudge category is a quieter set of matches by survivorship alone. The decade-by-decade cut says otherwise. In every decade since 1970, grudge matches sit below the non-grudge average. No exception now. The 1970s sit below by 0.6 cards a match; the 2020s by 1.6. Every other decade lands somewhere between.
The baseline rises across the period. World Cup matches in the 2000s averaged more than four cards per game; the 1970s averaged below two. The whistle has gotten louder for everyone. The grudge gap is the gap, and the gap does not flip.
Cold War, colonial, militarized. Pick one. None changes the answer.
You can chase the conventional wisdom into the rivalry-type weeds. Maybe COW militarized disputes are too broad. Maybe colonial ties are too old. Maybe the real heat is in the Cold War and partition pairs - the Germanies, the Koreas, the Yugoslav successors.
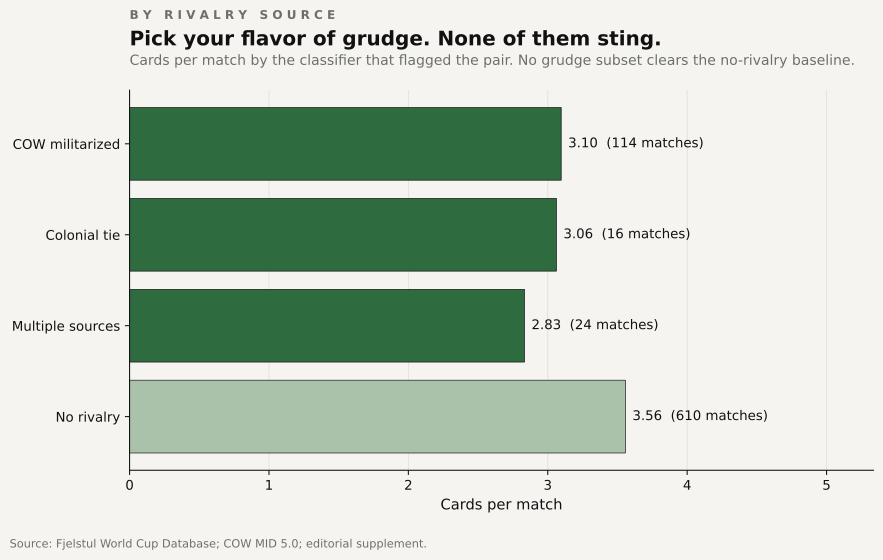
It is not. Every grudge subset comes in below the no-rivalry baseline. COW-flagged pairs average 3.10 cards per match. Colonial-tie pairs average 3.06. The multi-source subset - pairs that show up in two or more classifiers, the deepest grudges in our table - averages 2.83. The non-grudge baseline averages 3.56. There is no slice where the popular hypothesis recovers.
The trope rides on a dozen famous nights. The data rides on every other night the cameras came and the cards did not.
The other pocket stays shut, too.
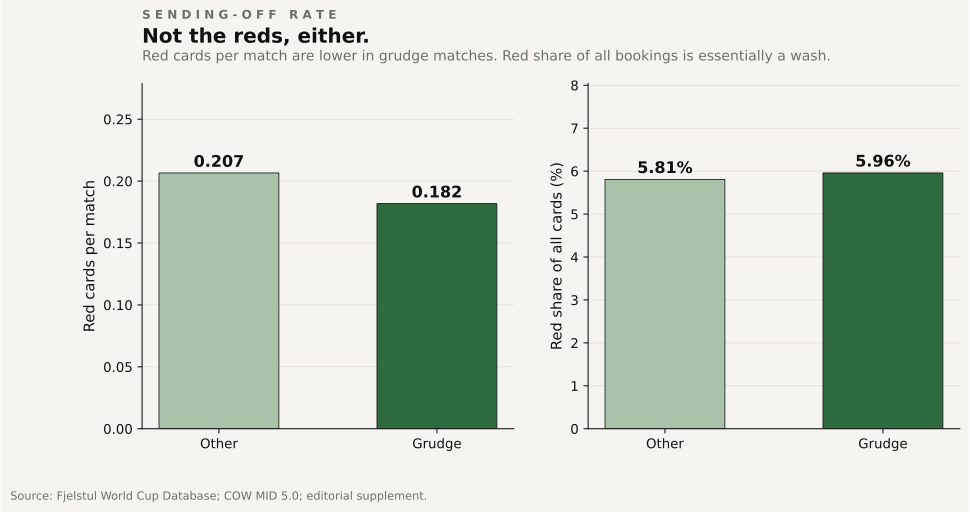
Maybe cards per match is the wrong measure. Maybe the trope is really about sendings-off - the rare, the violent, the ones that show up on the highlight reel. Red cards per match: 0.18 in grudge games, 0.21 outside them. Same direction as the yellows. The red share of all bookings - 5.96 percent in grudge matches versus 5.81 percent outside them - is a rounding error, not a signal. Grudge matches produce fewer reds per game and roughly the same red mix of the cards they do pick up.
The other pocket stays shut.
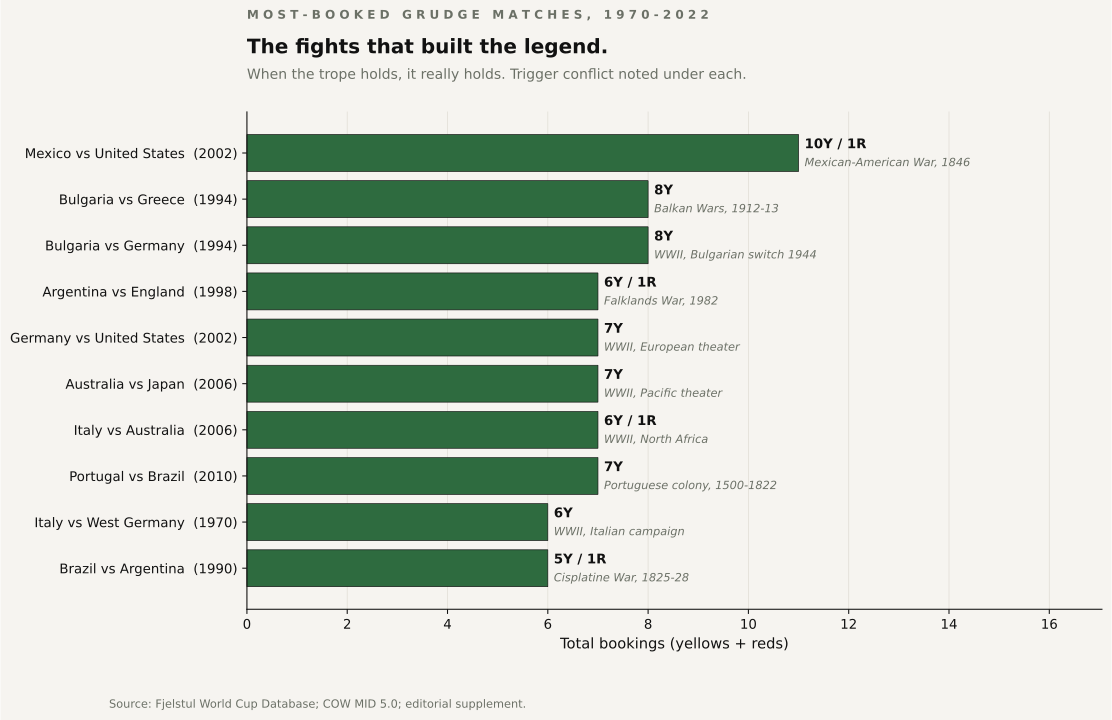
The fights that built the legend.
This is the part the trope gets from. The most-booked grudge matches in World Cup history are the ones people remember. Mexico against USA in the 2002 round of sixteen, eleven cards - a match the Mexican press called “the reconquest” against the country that took half its territory in 1846. The Bulgaria-Greece group-stage and Bulgaria-Germany quarter-final inside a week in 1994, the Balkan and Eastern-Front ledgers settled with eight yellows apiece. Argentina against England in Saint-Etienne in 1998, with the Beckham red and the Falklands still in living memory. Australia against Japan and against Italy in 2006, two Pacific and North African echoes inside one tournament. Portugal against Brazil in 2010, the colonial pair with no other reason on file.
These are vivid, true, and unrepresentative. They are the handful of matches that anchor the trope. The other 145 grudge matches in our table - quietly, decade after decade - sit underneath the global average.
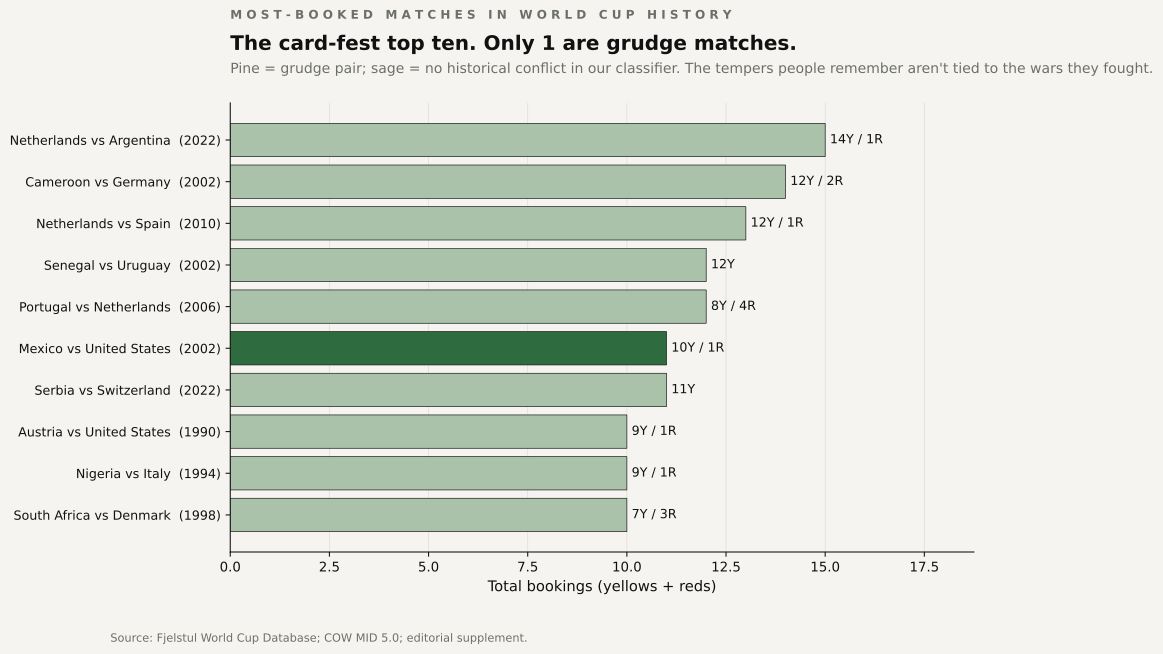
The actual card-fests aren't grudges.
The gap shows up most clearly when you flip the question and ask what the actual top of the card-fest distribution looks like. Netherlands against Argentina in 2022, fifteen cards. Cameroon against Germany in 2002, fourteen. The 2010 Netherlands against Spain final, thirteen. Senegal against Uruguay in 2002, twelve. Portugal against Netherlands in 2006, twelve. Mexico against USA in 2002, eleven. Serbia against Switzerland in 2022, eleven. Austria against USA in 1990, ten.
One of the ten most-booked matches in World Cup history is a grudge pair in our classifier. Nine are ordinary cross-continent pairings between countries with no recorded war, no colonial tie, and no named regional conflict. The matches that empty referees’ pockets are not, in aggregate, the matches with the most history behind them.
The trope survives because memorable matches are not representative matches.
This is where a story like this usually wants to end on a deeper note. Some suggestion that the grudge is internalized, that it manifests in ways the cards cannot count, that there is a sociological reading the data missed. We are not going to write that line.
What the data says is narrower and more useful. Across men's World Cup matches since 1970, card counts show no meaningful relationship with geopolitical history. The matches that produce the most pocket work are matches where a tournament-stage decision, a single foul, a referee's threshold, or a tactical setup collides badly. Whether the two flags on the shirt carry a century of hostility is, at the level of yellow cards per match, an irrelevant input.
The next time someone tells you a World Cup fixture will be heated because the two countries have history, ask them which forty-five seconds of which 1986 match they are quoting. The full fifty-two years of bookings will not back them up.