Golden Generation
Every major footballing nation eventually believes it has one. The fans wait for them, the press christens them, and at some tournament between 28 and 32 years old the manager picks them one last time. Across fourteen men's World Cups, that is the version of the team that should not have boarded the plane.
- 26.4y
- Median age of WC winners
- 14 of 14
- Cups won by 25-28 teams
- 2.8×
- More likely to exit past 28.5
- 0
- Winners aged 28 or older
Football has changed. Players last longer. Careers extend into their thirties. The average World Cup team has aged by more than a year since 1970. The winners have not. Across fourteen tournaments the champion's average age has barely moved - and every team sent on “one last run” by the conventional golden-generation narrative has gone home before it. The 2026 World Cup is now testing this in real time.
World Cup teams live inside a three-year window.
Across 14 tournaments and 191 squads with available age data, the mean team average age is 27.0 years. Nearly 90% fall inside a three-year window - between 25.4 and 28.5 years old. The window is narrower than the fan vocabulary implies.
What matters is whether the whole team pulls the mean above the line.
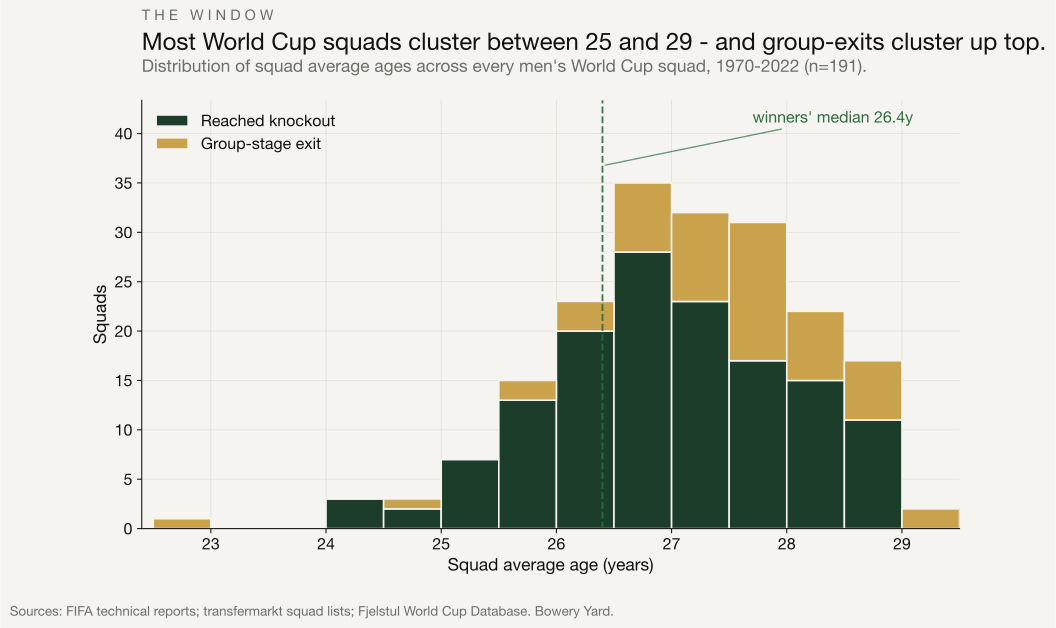
In the available-age sample, past 28.5, nearly one in two teams exits in the group stage.
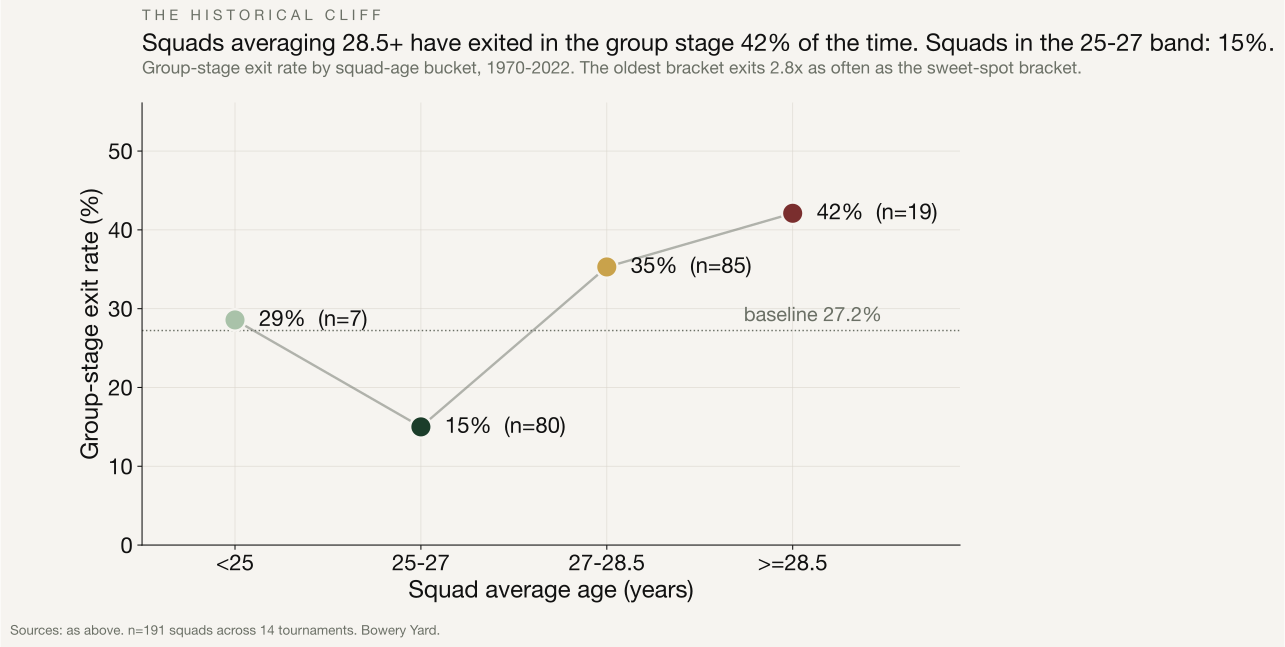
Bucket the teams by avg age and the historical pattern is one column. Teams in the 25.0-to-27.0 band have exited in the group stage 15.0% of the time. Teams averaging 28.5 or more have exited in the group stage 42.1% of the time.
The baseline group-exit rate across the whole sample is 27.2%. The sweet-spot teams beat it by twelve points. The oldest-bracket teams miss it by fifteen - 2.8 times as likely to exit in the group stage as teams in the 25-to-27 band.
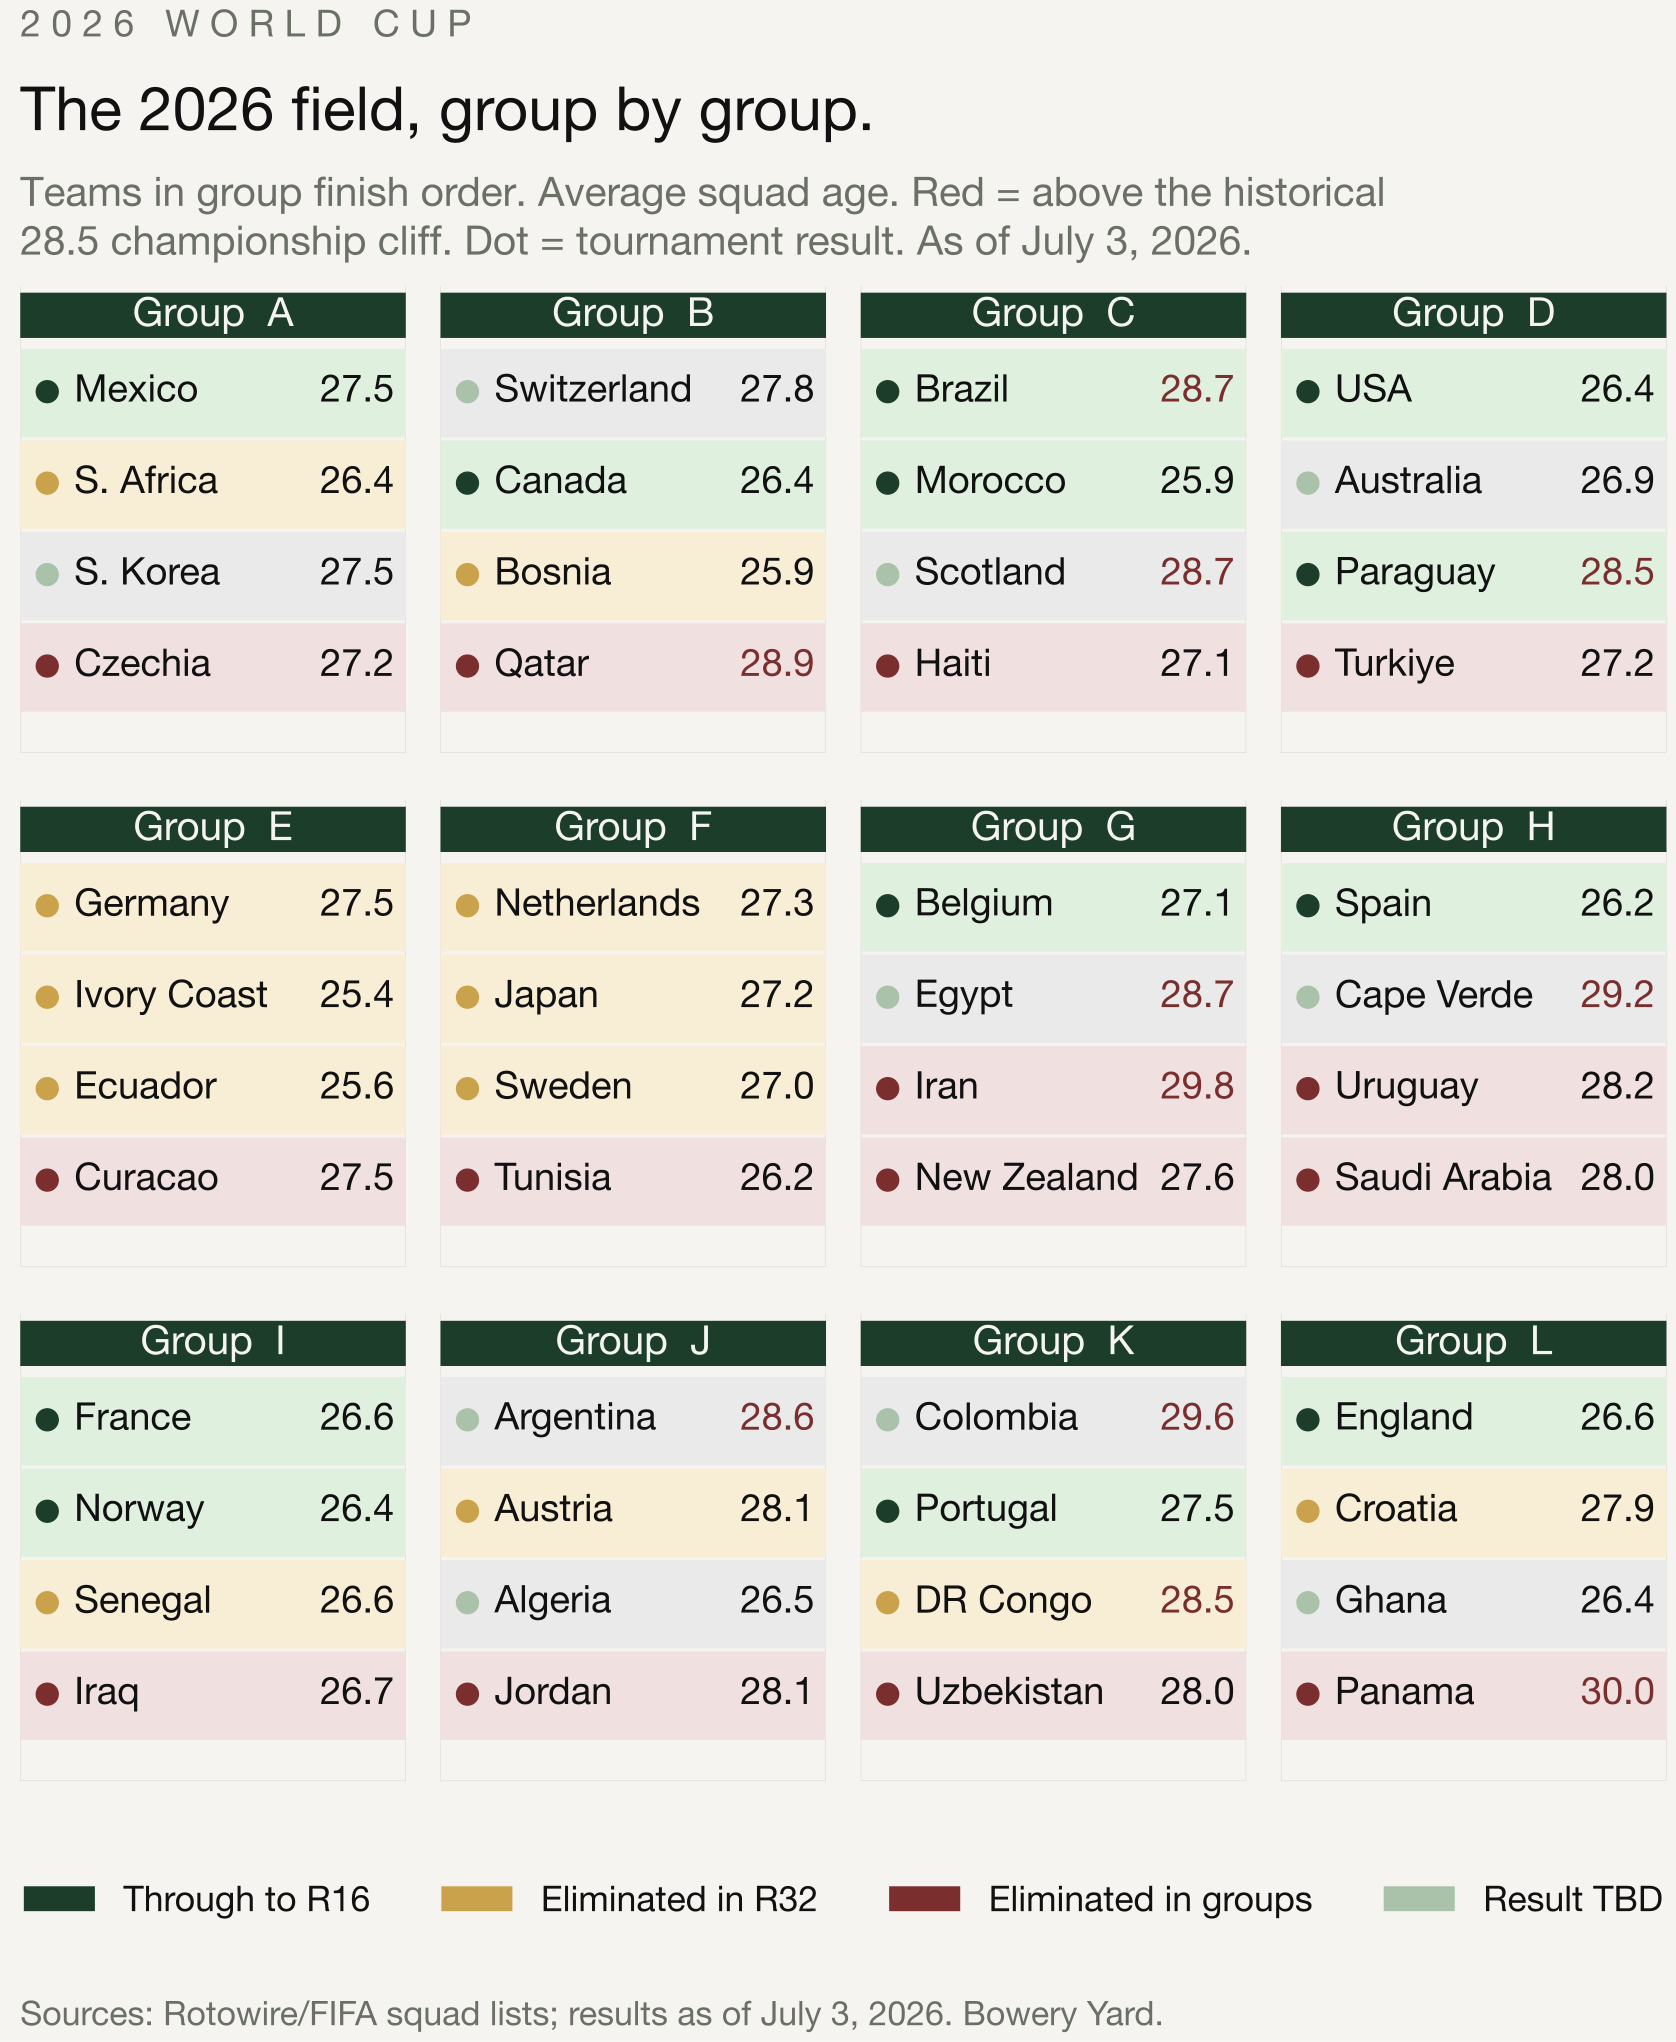
The early results of the 2026 tournament have so far been consistent with the historical pattern. Panama, the oldest team in the field at an average of 30.0 years, exited in the group stage. Iran, at 29.8, also went out. Qatar, at 28.9, did not survive either. Of the five oldest teams in the field, two - Colombia (29.6) and Cape Verde (29.2) - are still in the tournament as of this writing.
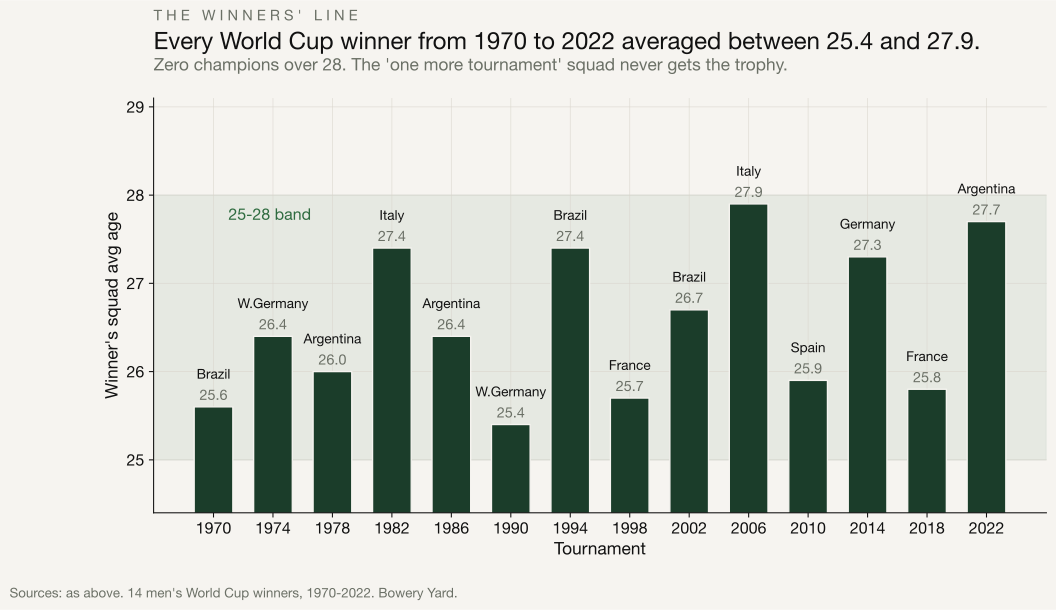
Every World Cup winner since 1970 was between 25.4 and 27.9.
The median winning team averaged 26.4 years. Brazil 1970 was 25.6 years old. Argentina 1986 - Maradona's - was 26.4. France 1998 was 25.7. Spain 2010 was 25.9. France 2018 was 25.8.
The oldest winning team of the modern era was Italy 2006 at 27.9 years old. Fourteen tournaments, fourteen winners, all inside a three-year band that ends before 28.
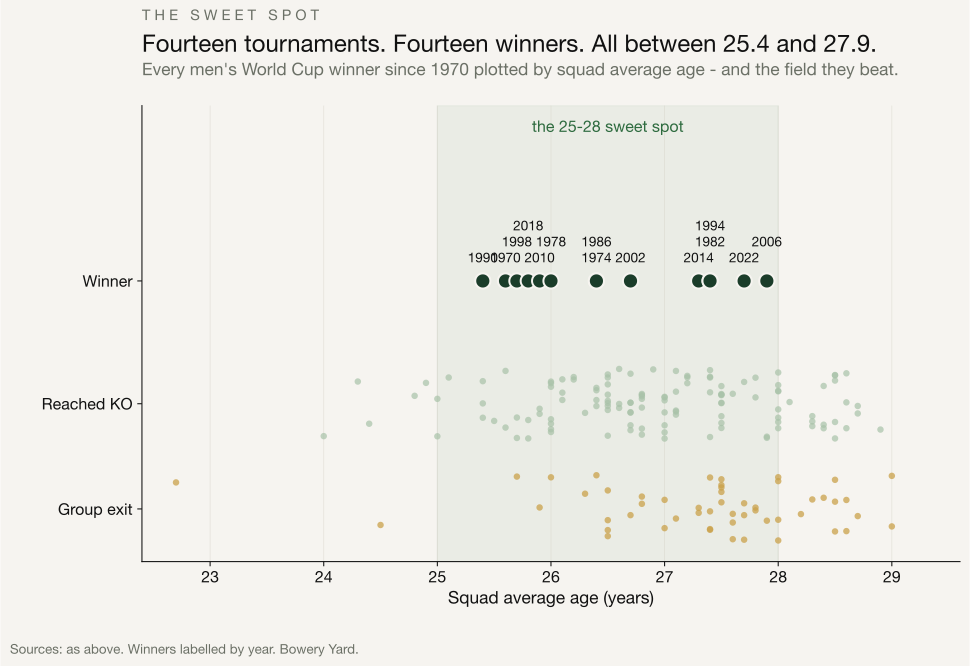
Fourteen tournaments. Fourteen winners. All inside a three-year band that ends before 28.
The famous Golden Generations averaged 28.5.
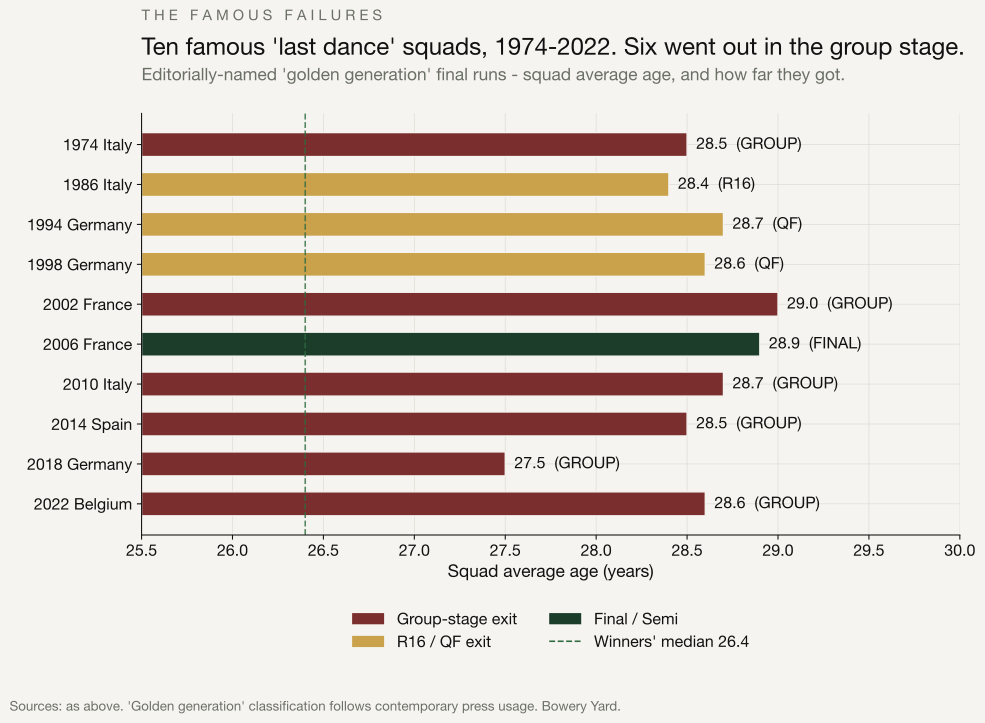
Editorial lists vary, but the same teams appear on every “Golden Generation” roster: Italy 1974, Italy 1986, Germany 1994, Germany 1998, France 2002, France 2006, Italy 2010, Spain 2014, Germany 2018 (commonly viewed as the final tournament of the 2014 title core), Belgium 2022.
The mean team average age across those ten is 28.54 years. Six of the ten exited in the group stage. Two more went out by the quarterfinal. The one that made the final - France 2006 - lost it, and Zidane headbutted his way into the clearest possible memory of why these runs end the way they do.
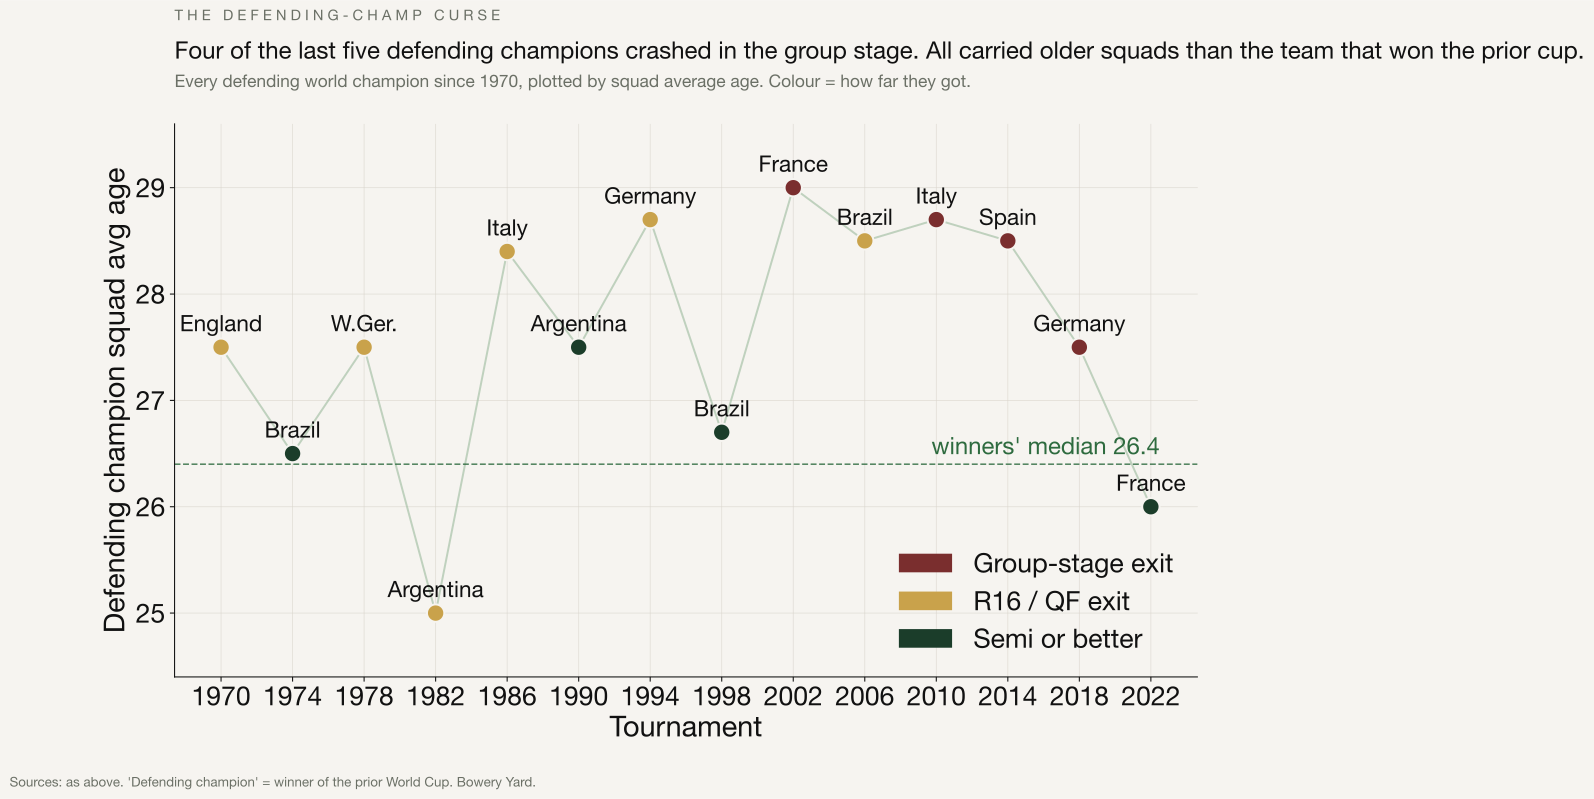
Four of the seven title-holders since 1998 went out in the group.
Defending champions are the cleanest natural experiment in the dataset. The core of the team you won with is four years older when the next whistle blows - and the replacements rarely replicate what the veterans gave you.
Of the seven World Cups from 1998 to 2022, four defending champions exited in the group stage - France 2002 (avg age 29.0), Italy 2010 (28.7), Spain 2014 (28.5), and Germany 2018 (27.5). The ones that didn't crash out early - Brazil 1998 and 2006 - lost the final and the quarterfinal respectively. Only France 2022, the youngest defending champion of the modern era at 26.0, made another final.
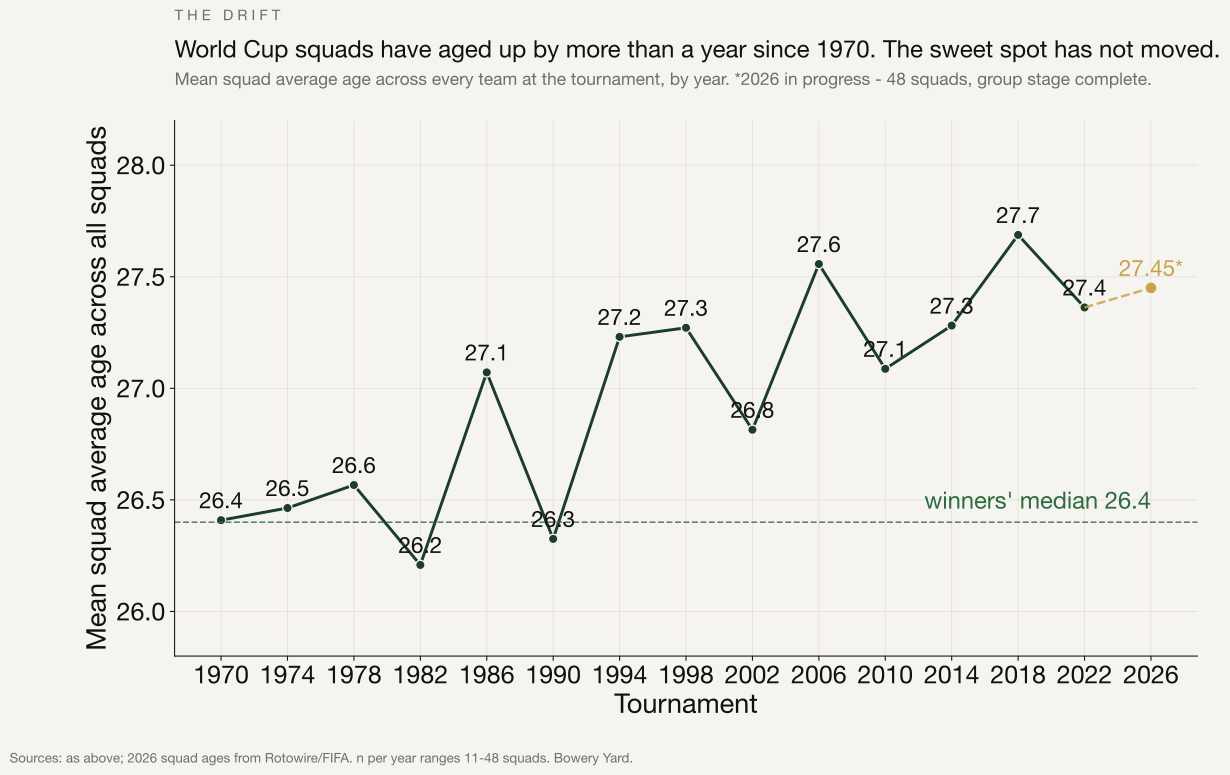
The whole tournament has aged up. The winners' window hasn't.
Mean squad average age across the available-age sample at the 1970 World Cup: 26.4. At 2018: 27.7. The 2026 tournament, with 48 teams, averages 27.5 - still more than a year above where champions sit, and still not coming back.
Modern football pays older players to be more valuable than they used to be - the salary, the brand, the captain's armband, the veteran of three Champions League finals - and managers drawn to names that already paid off once keep picking them. The chart keeps fixing. The data doesn't.
Every major footballing nation eventually has a Golden Generation. None of them wins it.
The names sell shirts and the names get picked. The data does not care about either. Twelve of the fourteen winning teams since 1970 averaged 27.5 years or less. None of them averaged 28.
The fans defend the legends because the legends gave them everything. The managers play them because they are the names. Historically, the numbers suggest picking the team whose average age will be 26 when the ball is kicked.
The thesis is running in real time.
This is early evidence, not proof. The tournament is still running and the sample is small. But the 2026 World Cup - 48 teams, 12 groups, a Round of 32 before the round of 16 - has so far followed the historical pattern closely.
The three oldest confirmed group-stage exits were Panama (30.0), Iran (29.8), and Qatar (28.9). The Round of 32 continued the sorting. Of the twelve teams confirmed in the Round of 16, eight averaged under 27.5 years; nine were 27.5 or lower. Spain (26.2) beat Austria 3-0. France (26.6) beat Sweden 3-0. The United States (26.4) beat Bosnia 2-0. England (26.6) beat DR Congo 2-1. Several were comfortable wins. These are the kinds of outcomes the historical age profile would lead you to expect.
Brazil (28.7) is through to the knockouts. Argentina (28.6) survived the group stage; their knockout-round status was not yet confirmed at time of writing. Across 54 years of data, no team averaging 28 or more has lifted the trophy. They are alive. History suggests they're on borrowed time.