
Paid in Minutes
Convert a metro fare from pesos or pounds into dollars and you learn nothing. Convert it into minutes of a local minimum-wage shift and a different map appears - one where the cheapest-looking tickets cost the most.
- 44 min
- Sao Paulo ride, in minimum-wage labor
- 18%
- Of an 8-hour day - a Sao Paulo round trip
- 20¢
- Cairo fare that outcosts NYC's $3.00 ride
- 5.8×
- Sao Paulo vs Mexico City, same flat-fare model
A subway fare has two prices. The one on the sign, and the one your morning costs you. They are not the same number, and across most of the world they are not even close.
A metro ride, priced in a worker's minutes
The Minimum Wage Transit Index is a single division problem: the standard adult fare of a city's metro, divided by that city's statutory minimum hourly wage, expressed in minutes of work. It strips the currency out. What is left is how much of a low-wage worker's day the turnstile takes.
The minimum wage, not an average wage, because the index is designed to compare affordability at the lowest legal rung of each economy. The wage floor provides a standardized benchmark for comparing how heavily a bare fare bears on workers at the bottom of each country's wage scale.
Run it across 13 cities and one result sits far above the rest. A single ride on the Sao Paulo Metro costs a minimum-wage worker about 44 minutes of labor. The fare is 5.40 reais; the Brazilian minimum wage works out to 7.37 reais an hour. Nearly three quarters of an hour of work buys one ride, one way.
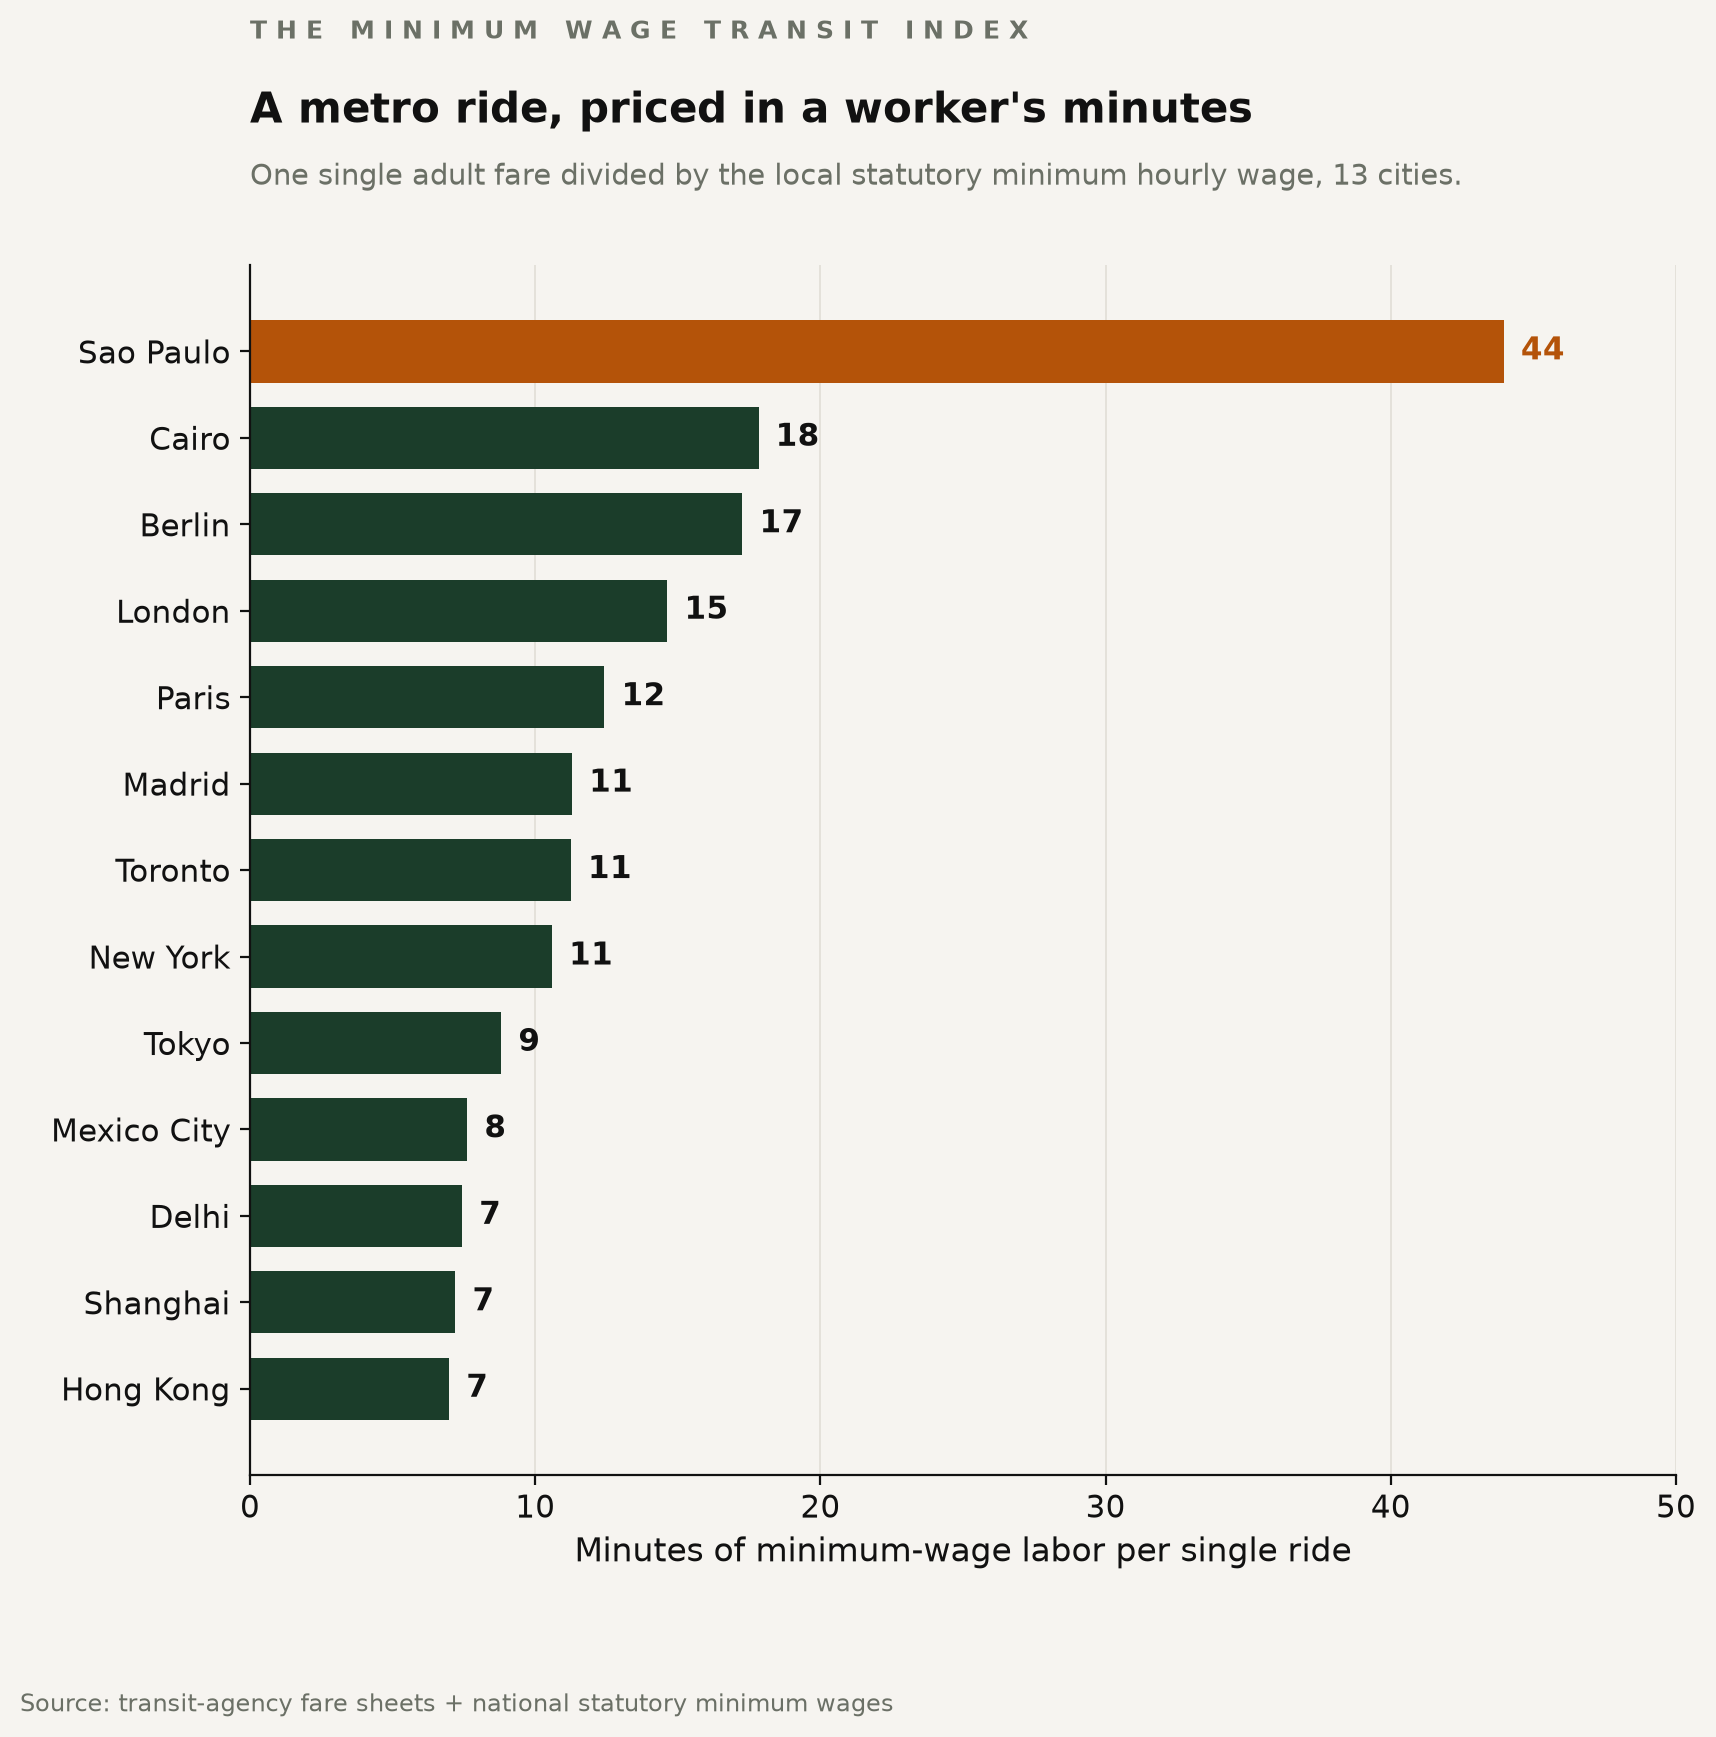
New York, by contrast, charges 3.00 dollars - the third-priciest nominal fare in the set, behind Berlin and London - against a 17.00 dollar minimum wage. That ride costs about 11 minutes. The same act, four times the labor.
At full fare, a Sao Paulo round trip is 88 minutes - about 18 percent of an eight-hour minimum-wage day. That is a full-fare benchmark, not observed spending; covered workers pay less, and the stakes section returns to why.
The dollar price tells you almost nothing
The traveler's instinct is to convert. A ride in Cairo is about 20 cents; a ride in Berlin is over 4 dollars; so Berlin must be the expensive one. As a statement about a tourist's wallet, that is fine. As a statement about the city, it is useless.
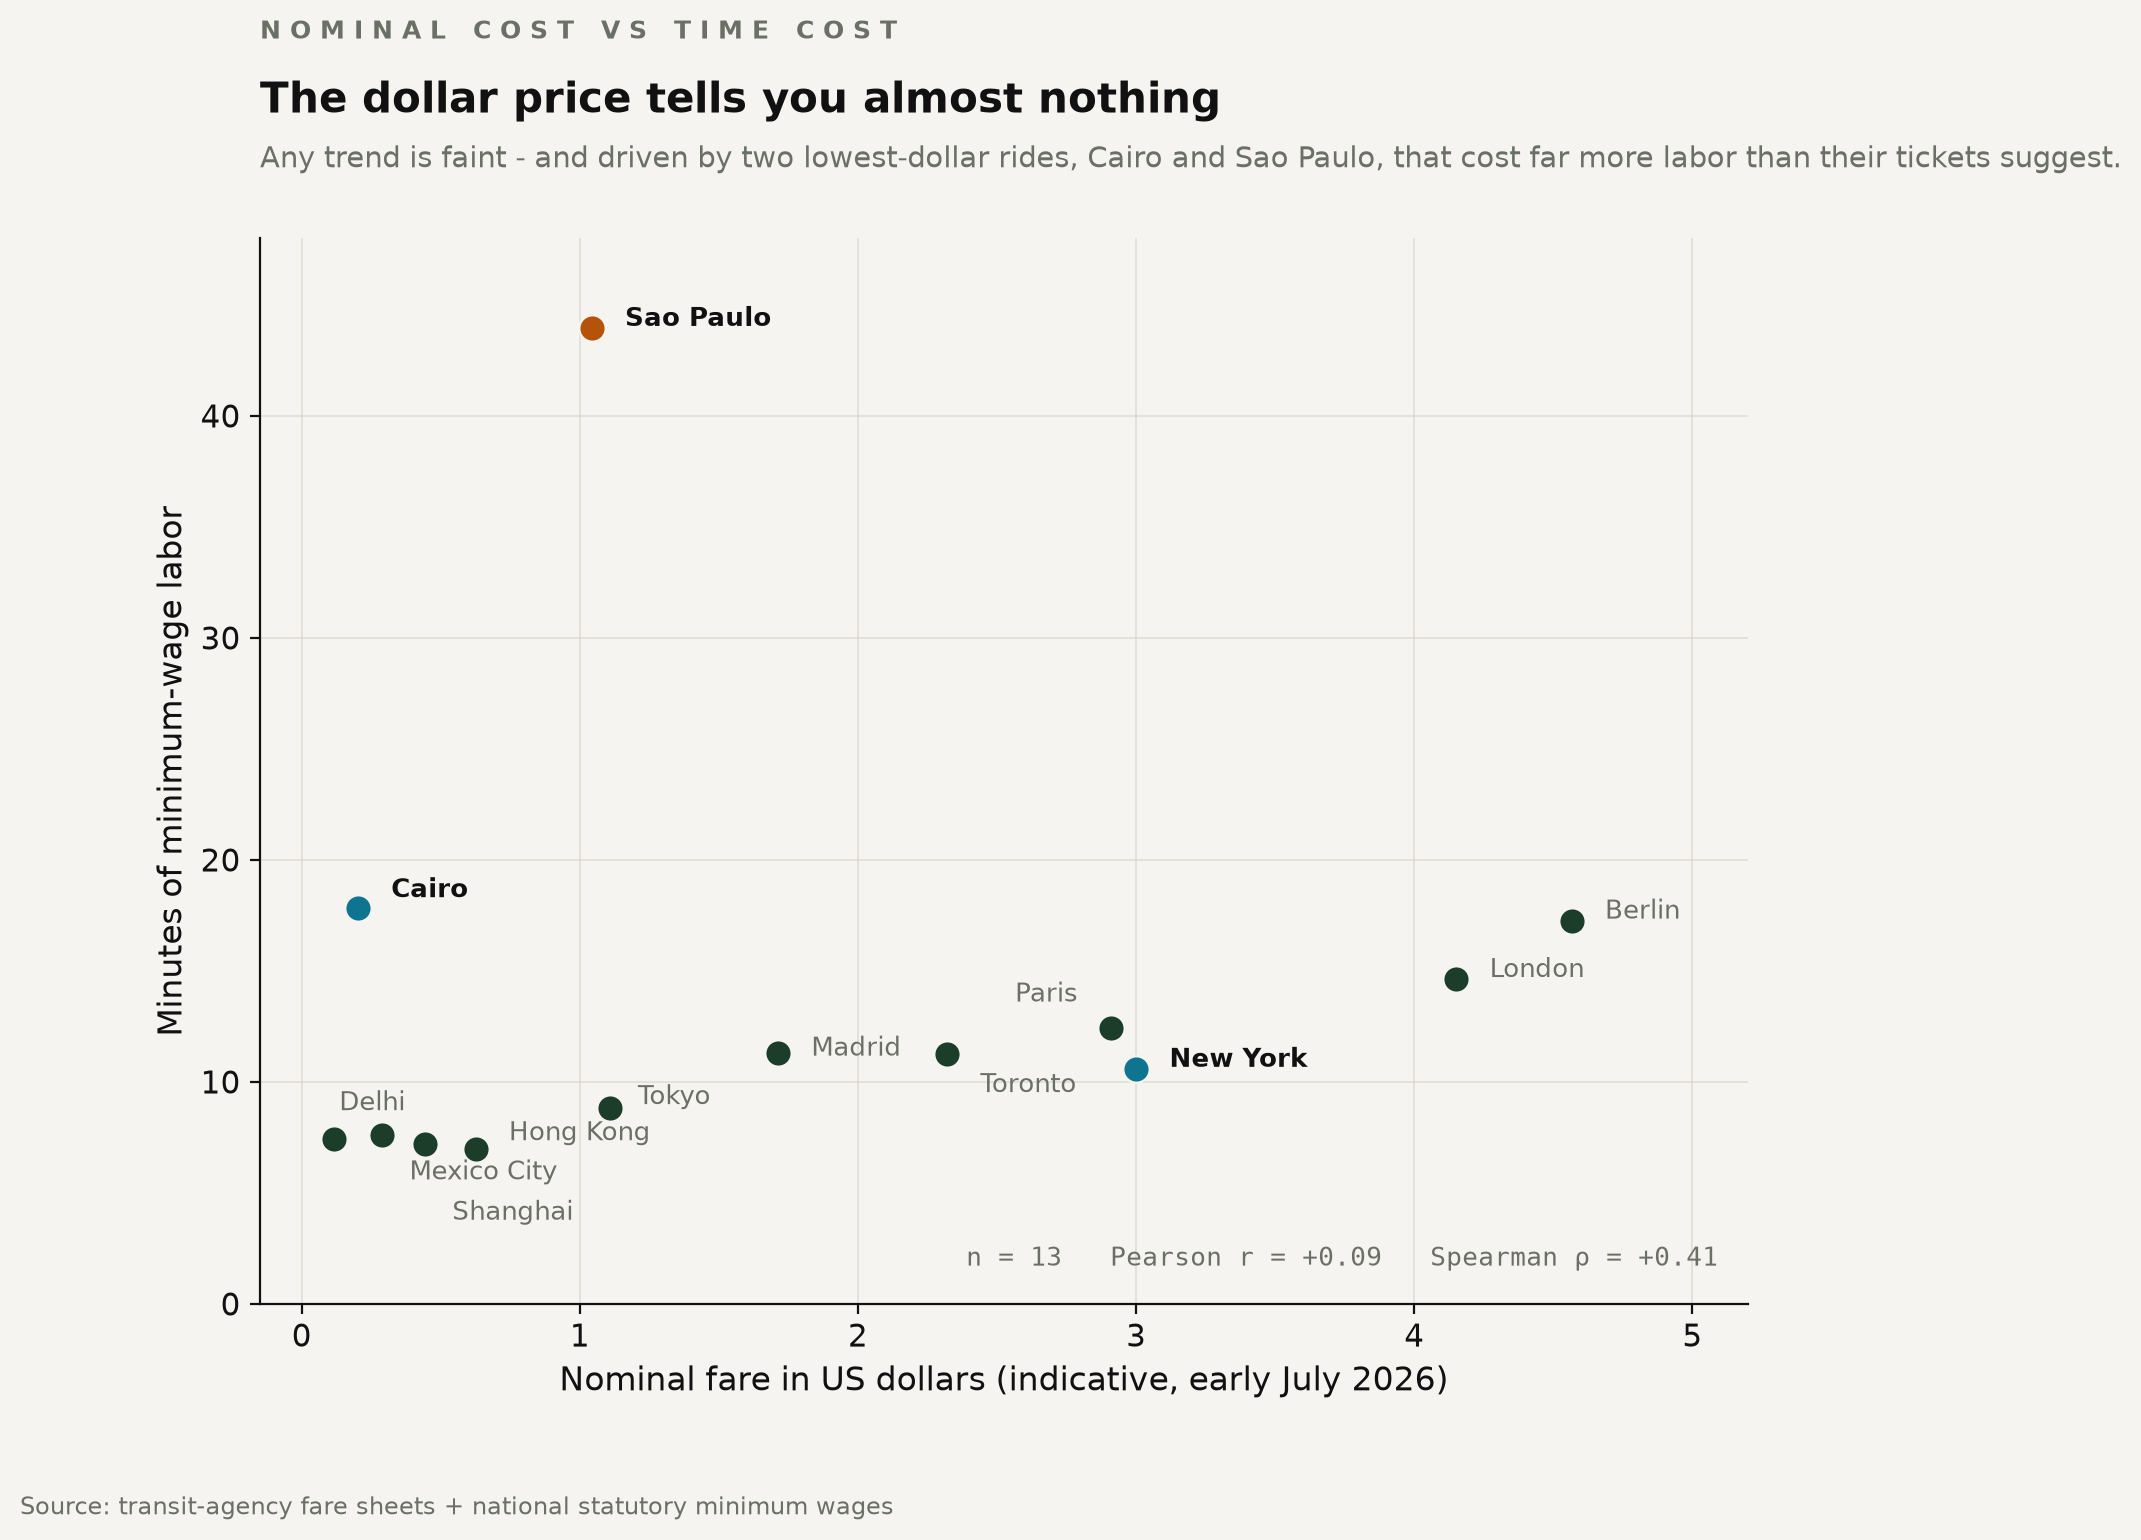
Plot the nominal dollar fare against the minutes it costs and there is little obvious relationship across these 13 cities. Cairo's 20-cent fare costs nearly 18 minutes of Egyptian minimum-wage labor, and Sao Paulo's ride costs 44. Berlin's fare, more than twenty times Cairo's in dollars, costs about the same in minutes. The gap between what a ride costs in dollars and what it costs a worker is the finding.
Rank by dollars, then by minutes, and the list flips
Line the cities up by nominal fare, then again by minutes worked, and the two lists cross like shoelaces. Berlin and London top the dollar ranking and slide toward the middle of the labor ranking. New York falls from the third-priciest fare to the eighth-costliest ride. Cairo climbs from the second-cheapest ticket to the second-most-expensive commute. Sao Paulo, only mid-priced in dollars, rises to the very top.
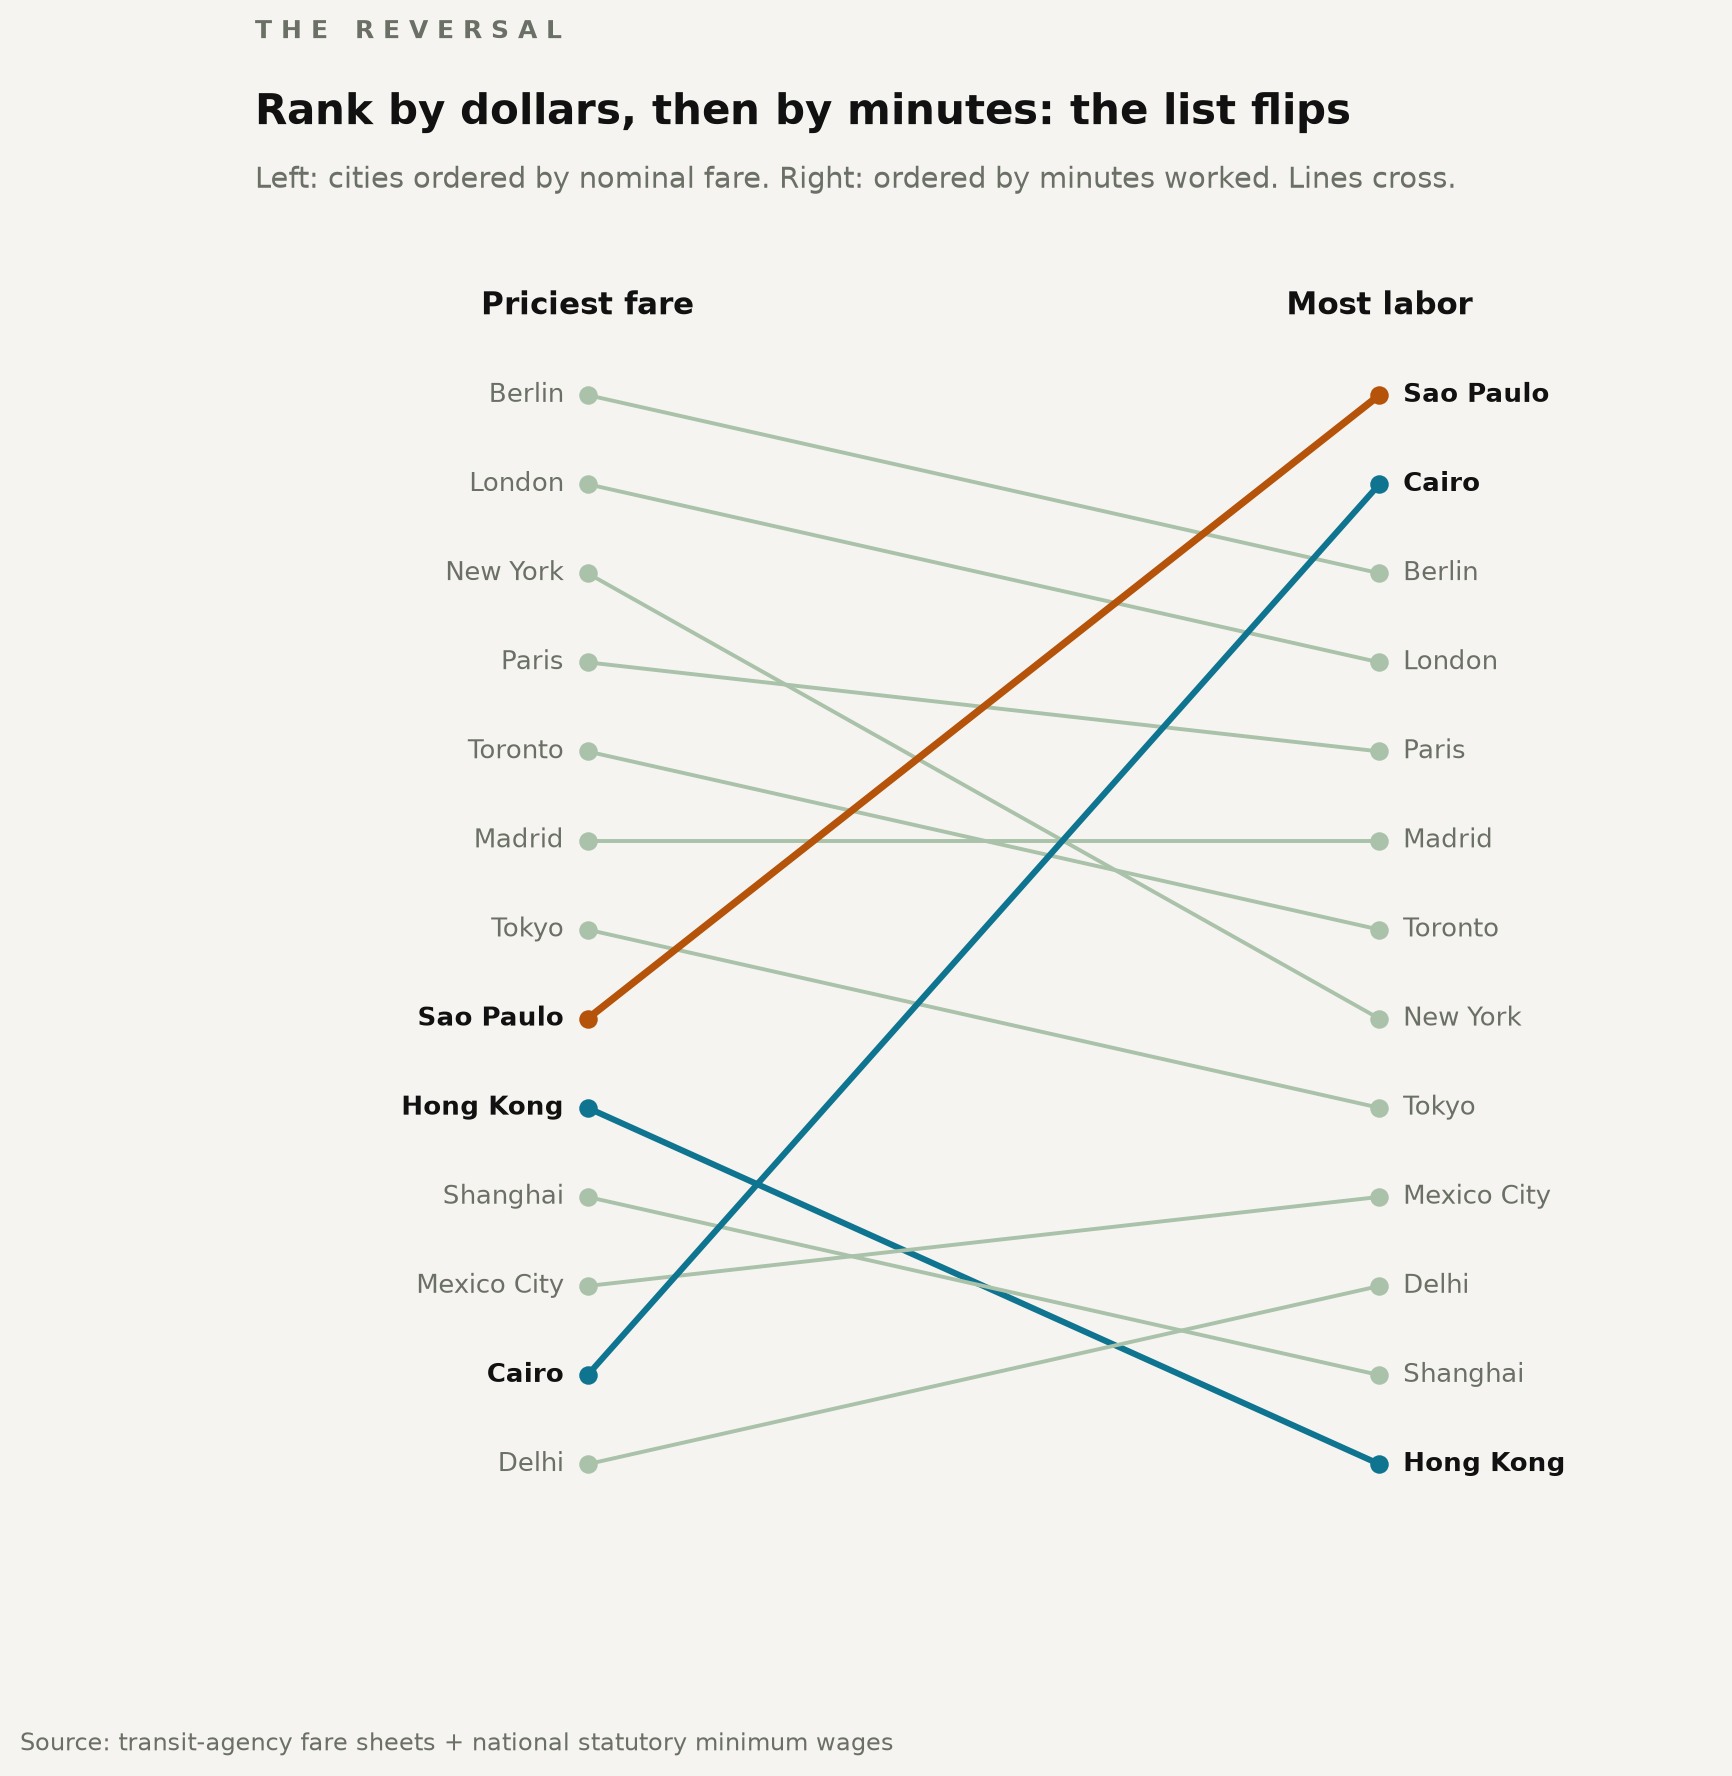
Several of the highest-wage cities also charge some of the highest nominal fares. Their wage floors are high enough that those fares consume relatively little work time.
Same flat fare, a different planet
One objection is fair: some of these systems charge by distance, and using the base fare flatters them. So narrow the field to the cities whose single fare covers any trip on the network at one price - no distance tiers, no zone surcharges. New York, Toronto, Paris, Mexico City, Sao Paulo. (Madrid's Zone-A ticket tiers by number of stations, and Berlin's ticket price rises with the zone combination - both sit in the distance-priced group under a strict reading.)
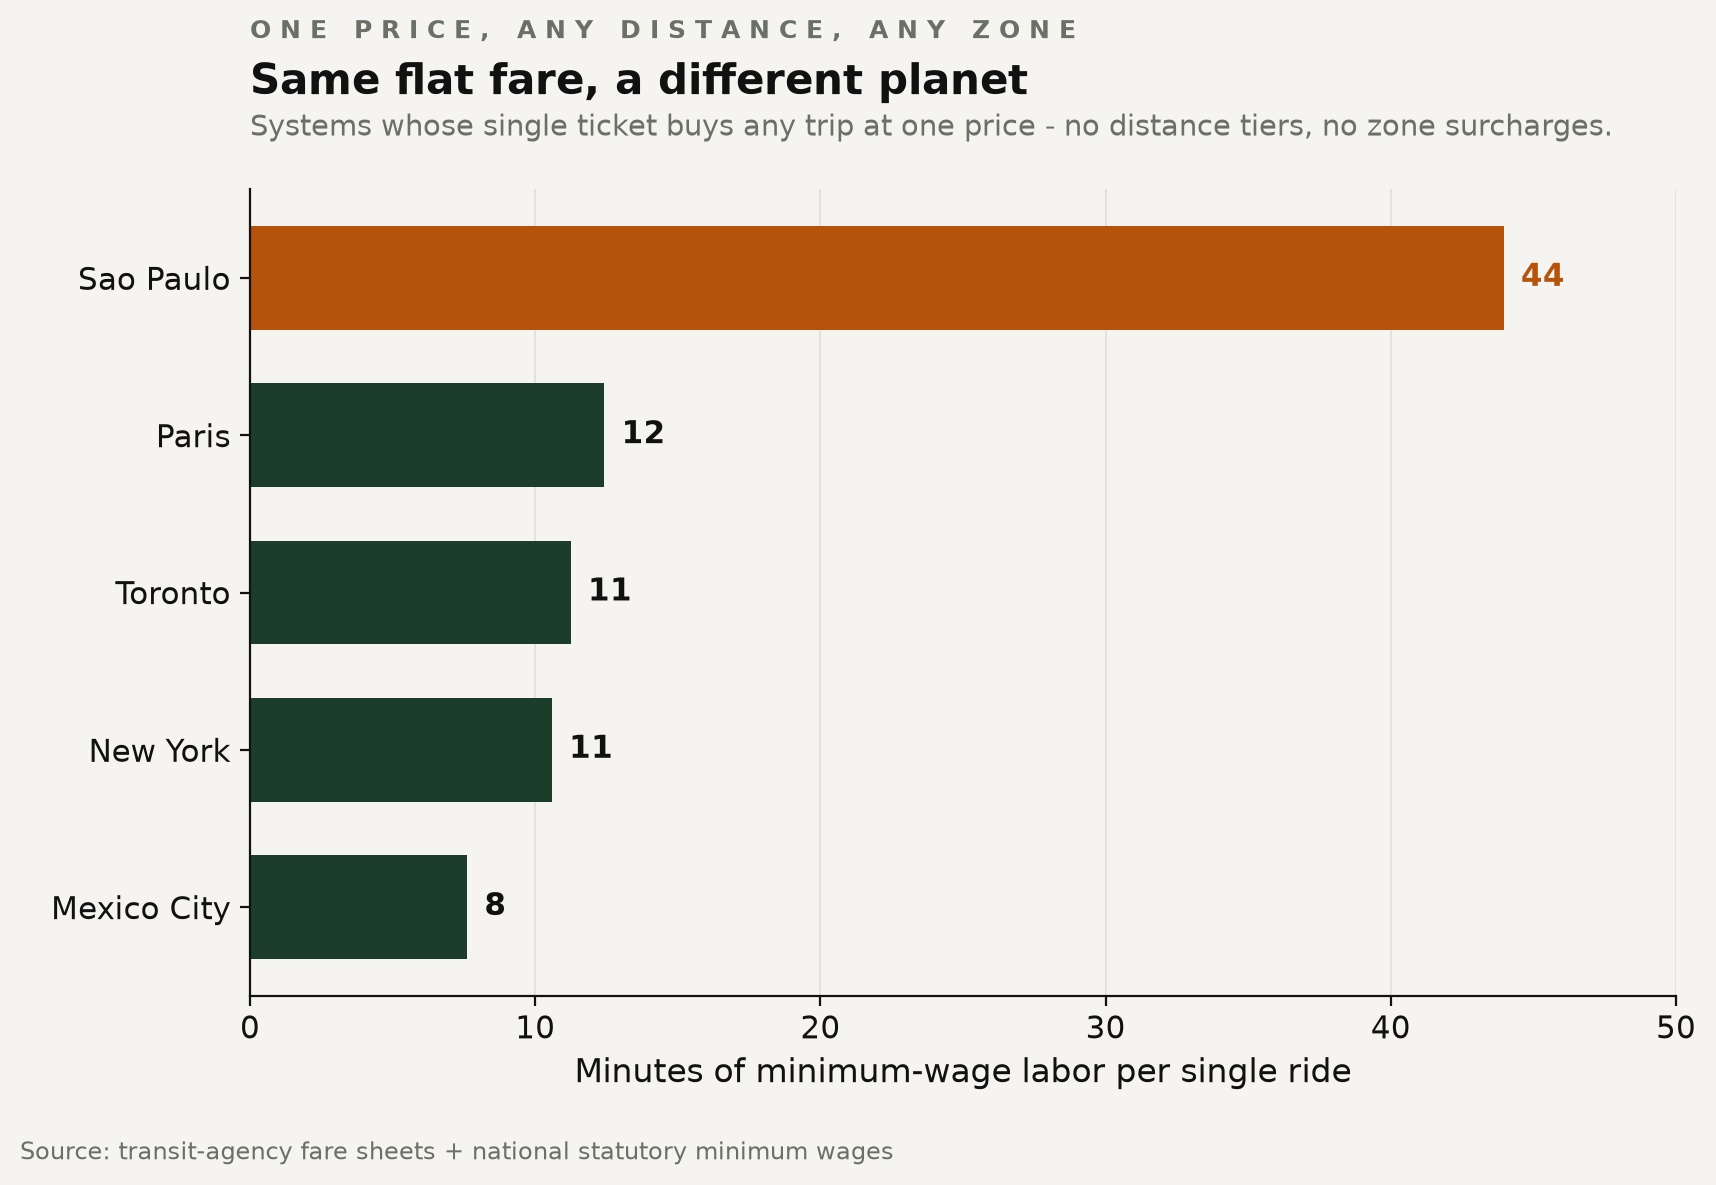
The spread does not shrink; it sharpens. Mexico City and Sao Paulo run almost the same flat-fare model - a single ticket of roughly five local units, good for the whole network. In dollars, both land near a dollar. In minutes, Mexico City costs under 8 and Sao Paulo costs 44, almost six times as much. Two Latin American megacities, one fare structure, and a minimum-wage rider in one gives up nearly six times the labor of a rider in the other.
Mexico City's heavily subsidized 5-peso fare produces one of the lowest burdens in this sample. Sao Paulo's flat fare, one of the highest.
A 20-cent ride in Cairo costs a worker more of the day than a 3-dollar ride in New York. The price tag and the sacrifice point in opposite directions.
The cheapest ticket, the most expensive ride
Hold three cities side by side. New York charges 3.00 dollars, Cairo about 20 cents, Sao Paulo just over a dollar. By the ticket, New York is the expensive city by a wide margin.
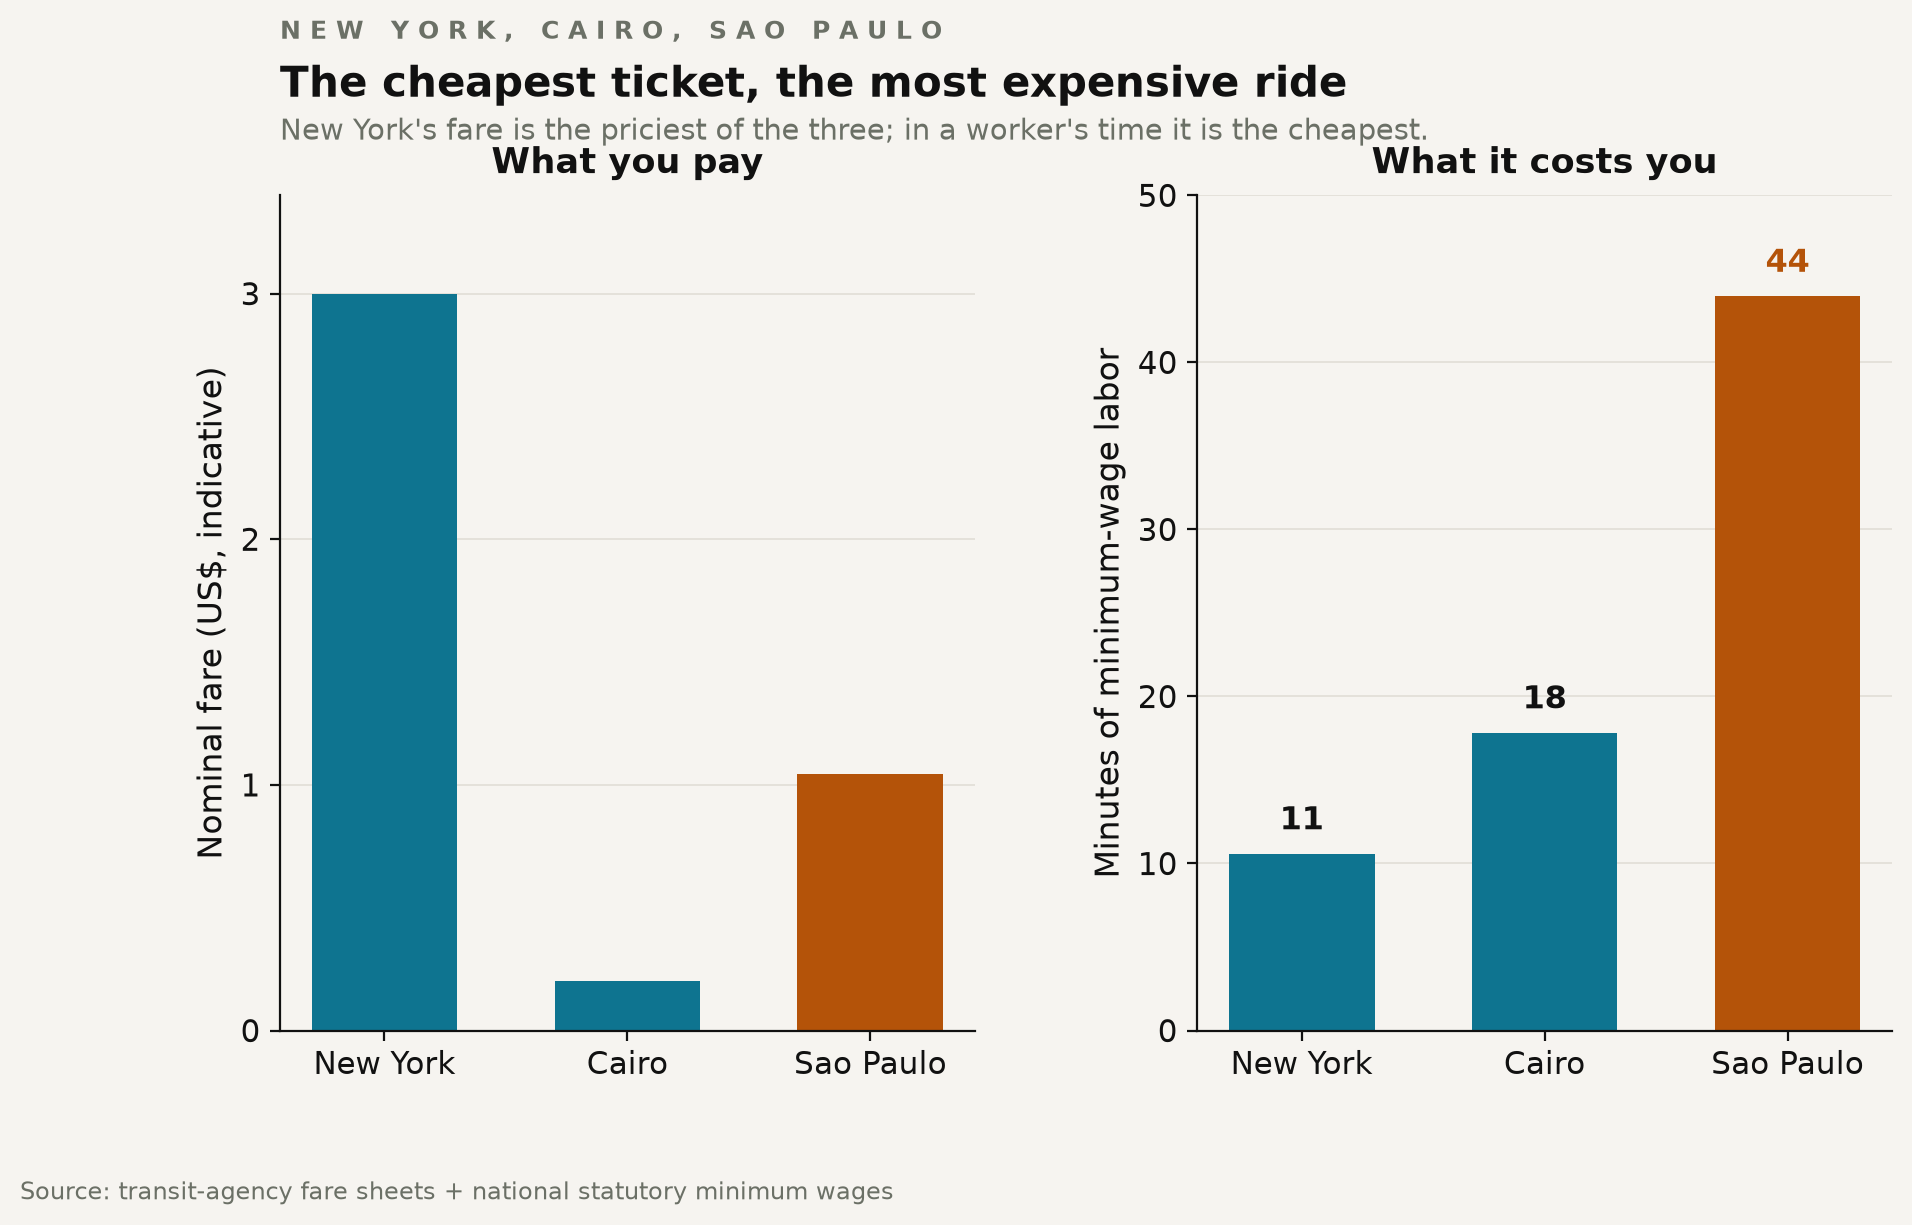
By the clock, it inverts. The New York ride costs about 11 minutes of minimum-wage work. The Cairo ride - a fraction of the dollar price - costs about 18. The Sao Paulo ride costs 44. The cheapest ticket of the three buys the most expensive ride; the most expensive ticket buys the cheapest. That is the whole argument, in six bars.
Same math, twelve much smaller answers
Sao Paulo's 18 percent is the extreme. The other twelve cities in the sample cluster between 3 and 7 percent - New York and Tokyo near 4, London and Cairo near 6 to 7, Mexico City, Delhi, Shanghai and Hong Kong hovering at 3. The gap between Sao Paulo and the next-highest city is more than twice the entire range of the other twelve.
And that 18 percent is a full-fare benchmark, not observed spending. Brazil's Vale-Transporte program caps a covered formal worker's commuting expense at 6 percent of gross wages, and passes, concessions, and monthly caps push the real bill lower still. What the index measures is what the ticket booth alone asks of a worker at the wage floor - with no employer benefit, no pass, and no discount.
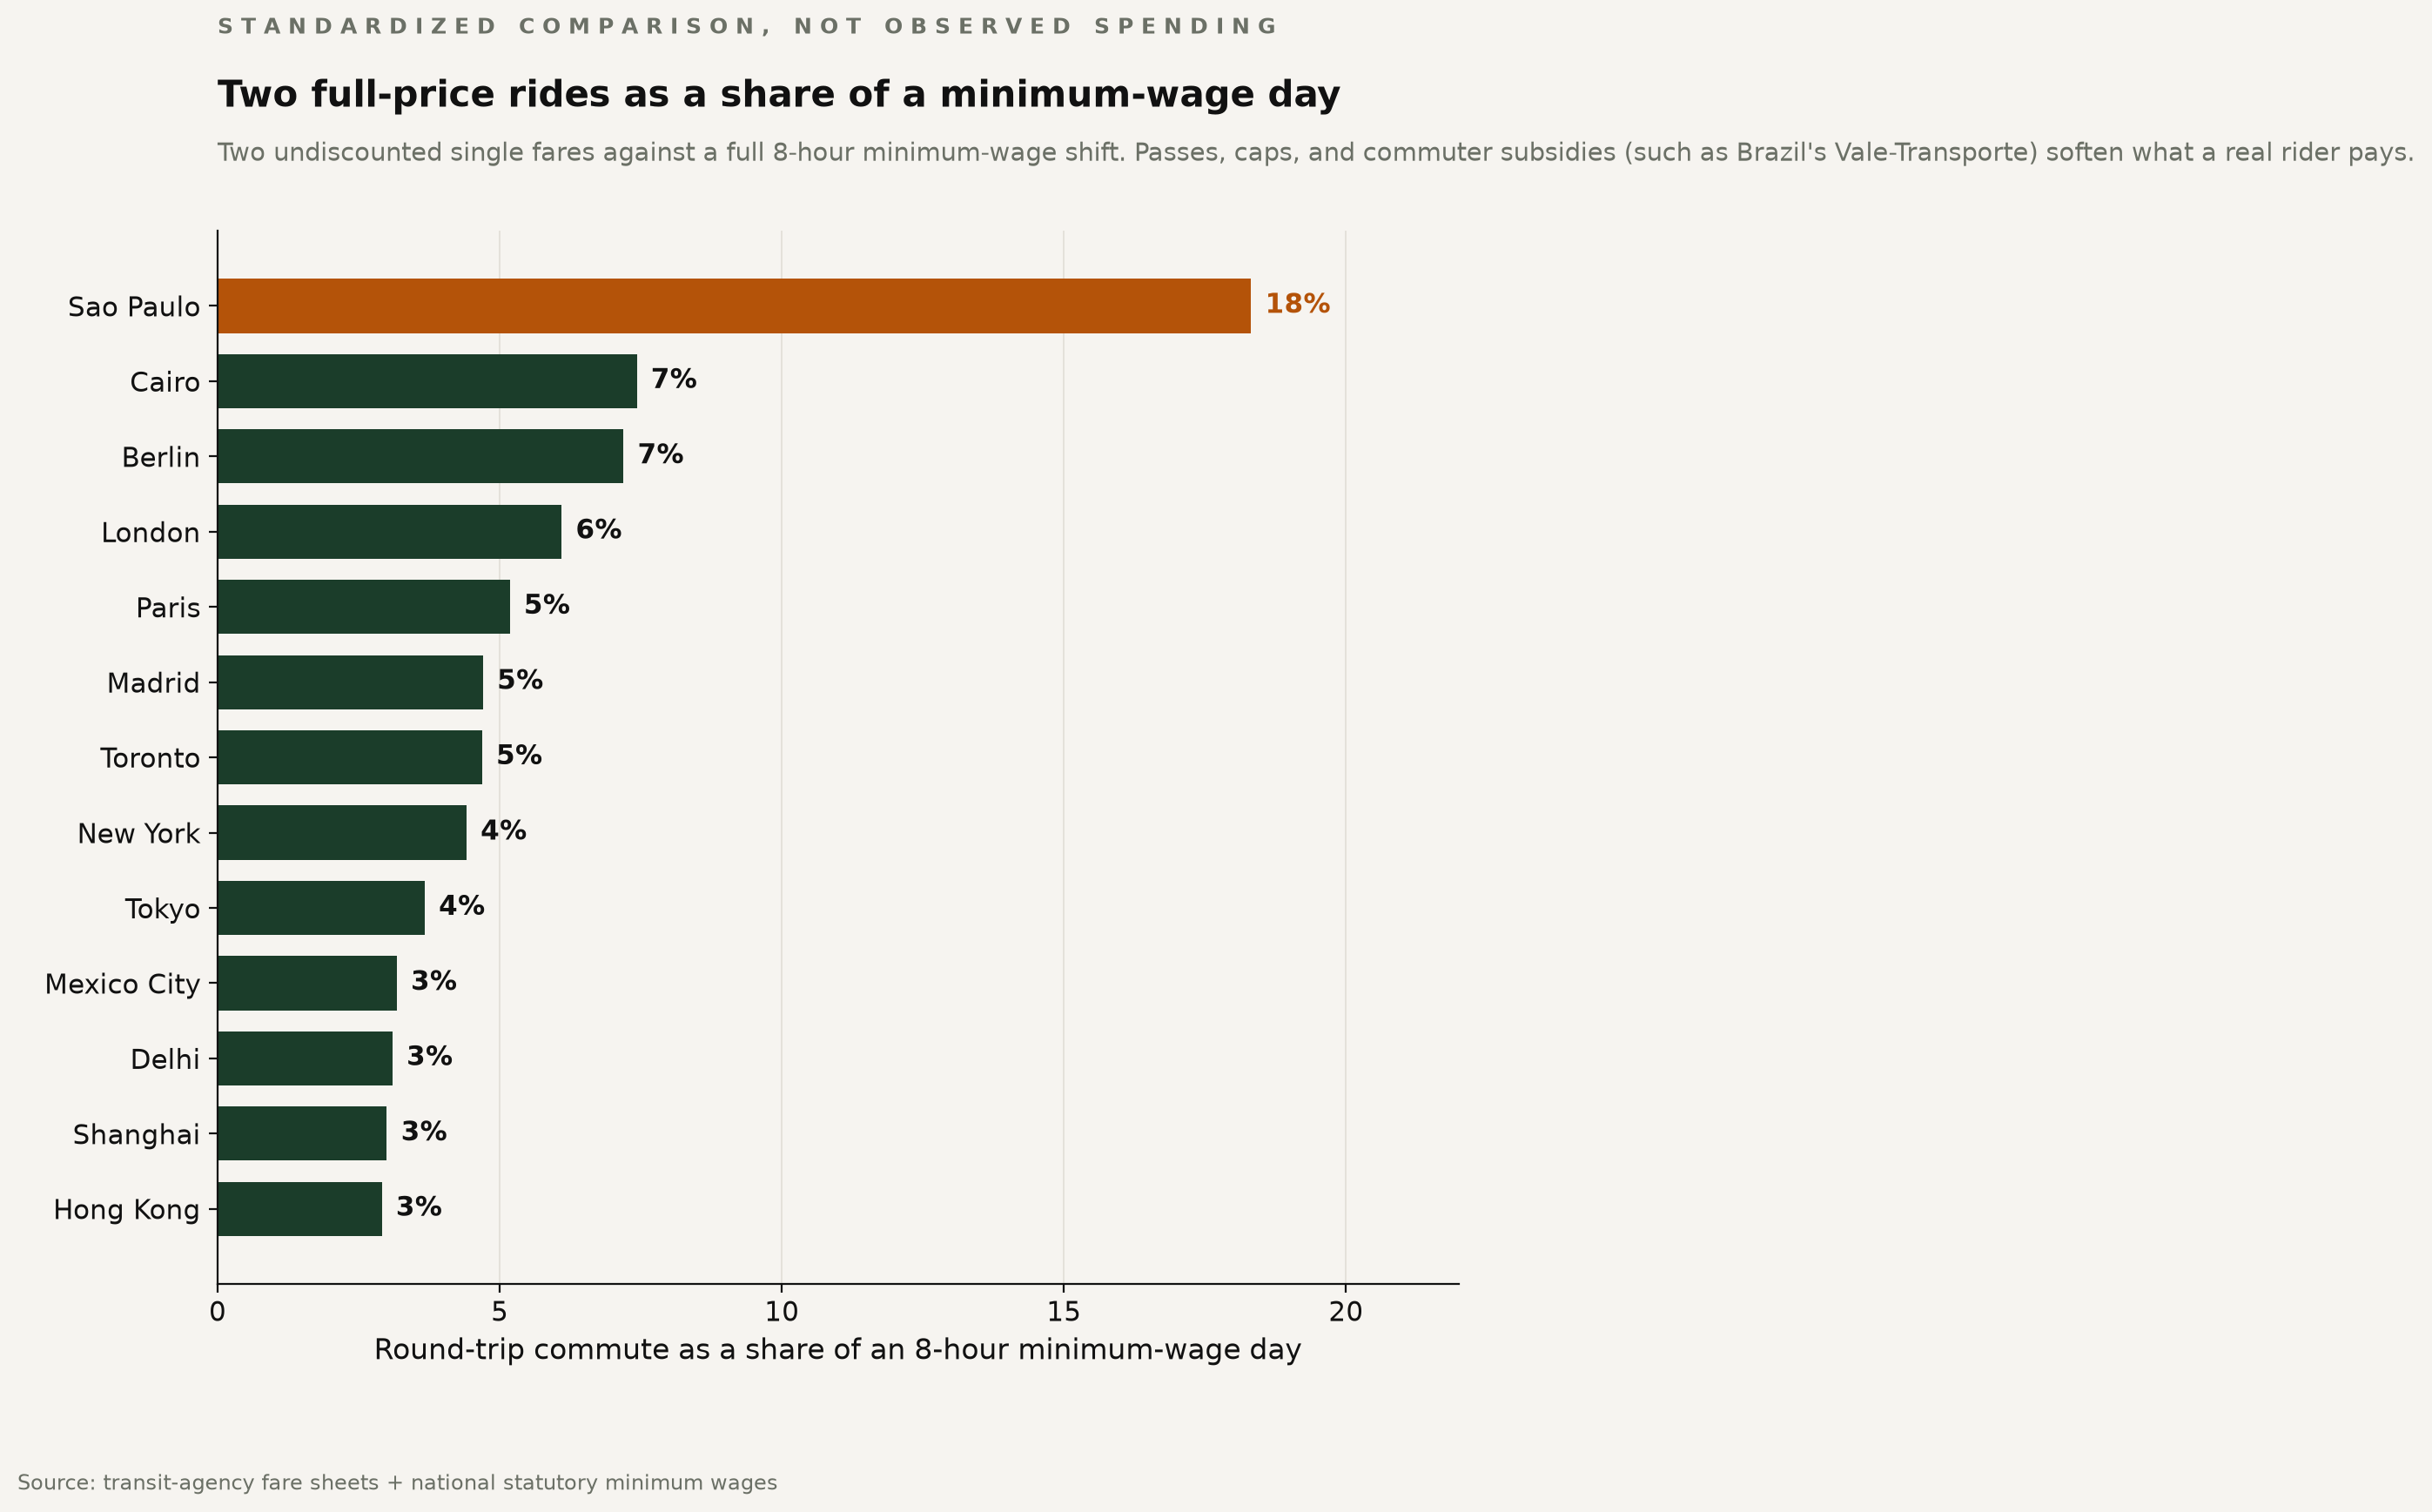
Why does the standardized burden vary so much? Most of it is the wage floor. Plot minutes against the minimum wage in dollars and the poorer cities generally sit higher: the less an hour of work pays, the more of it a fixed fare consumes.
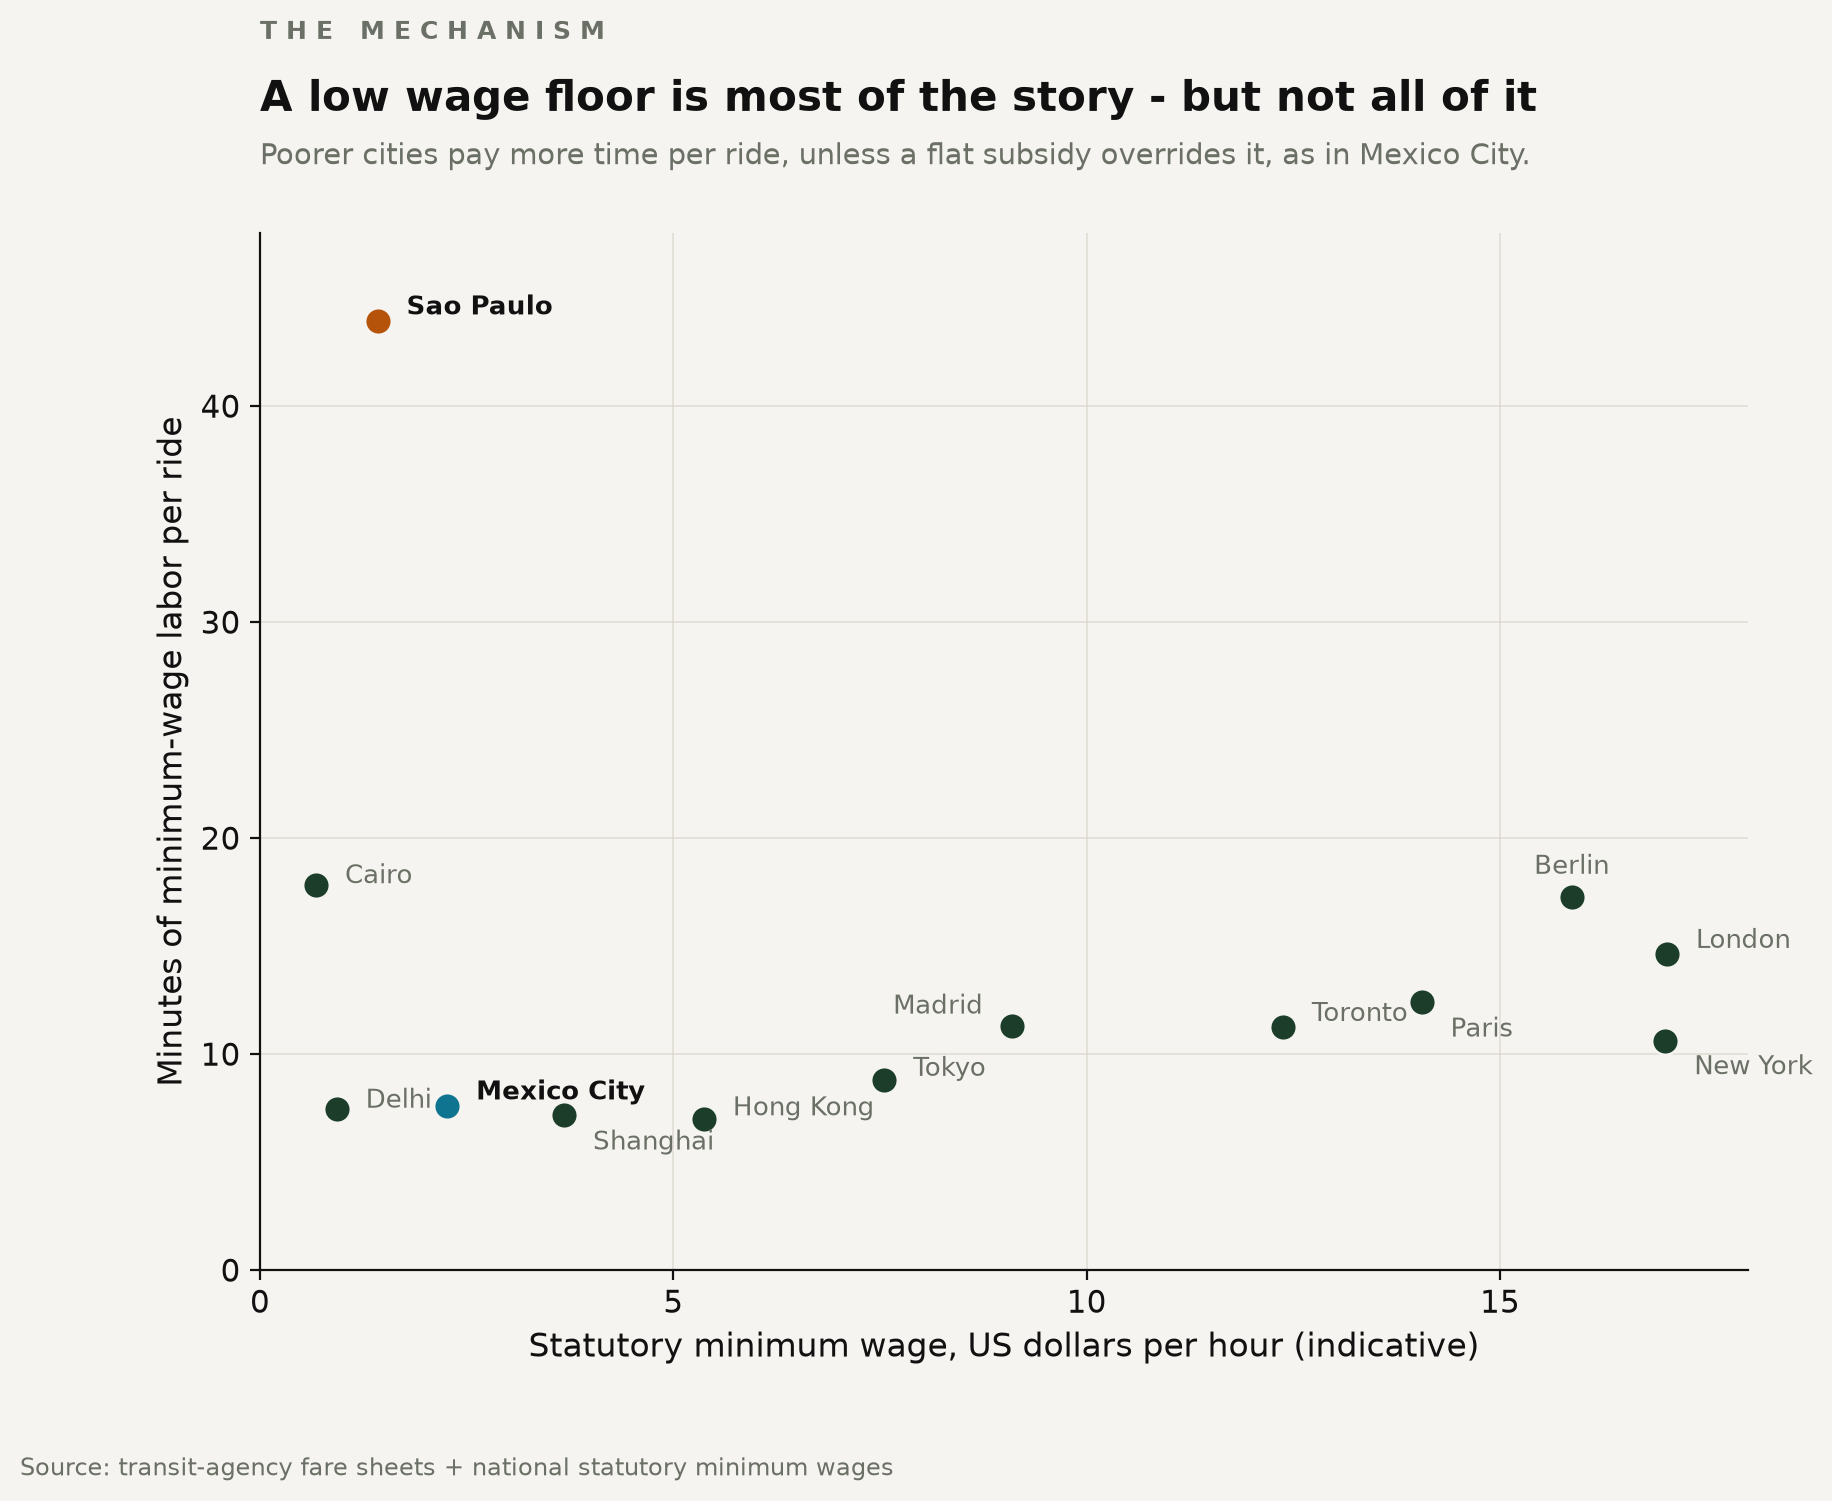
But the wage floor is not the whole story. Mexico City sits far below the line its low wages would predict, because a deliberately cheap, subsidized flat fare overrides them. Policy can beat the arithmetic. Sao Paulo shows what happens when it does not.
A flat fare is not a flat burden
The Minimum Wage Transit Index is a purchasing-power yardstick, not a receipt. It prices a single, full, adult fare against the wage floor. It does not net out the weekly caps, monthly passes, student rates, employer commuting subsidies, or low-income concessions that many riders actually use - all of which soften the real burden, and none of which change what a bare fare asks of an hour's wage. In the distance-priced systems, we used the base single fare, so a longer trip costs more than the figure shown.
What survives all of that is the shape. Whatever the fare structure, a given fare consumes more of an hour when an hour pays less. The dollar price tells you what a visitor pays. The minutes tell you what a city asks of the people who can least afford to give them.
On this measure, the most expensive subway isn't the one with the highest fare. It's the one that demands the most work. Across these 13 cities, that is Sao Paulo.