
The Cliff That Wasn't
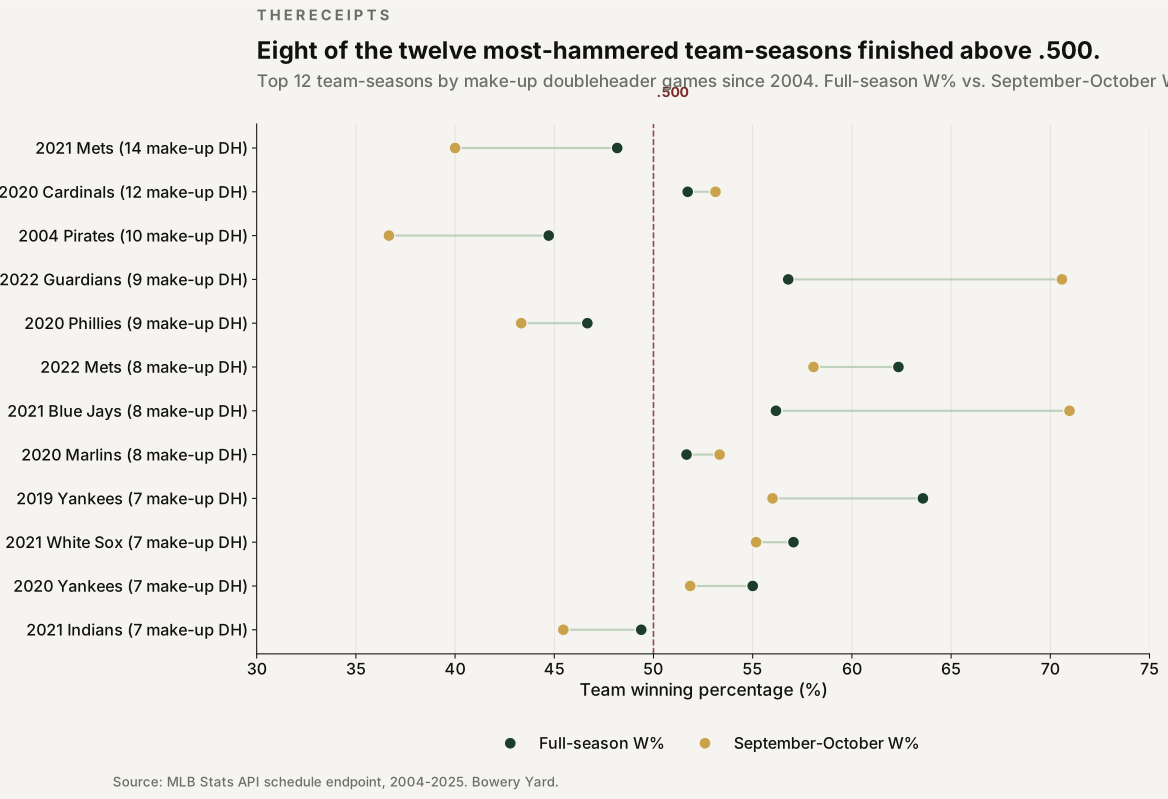
Fans blame September collapses on April rainouts, July doubleheaders, and 20-games-in-18-days death marches. Twenty-two Major League seasons say the standings do not agree. Of the 12 team-seasons most hammered by make-up doubleheaders, eight finished above .500. The cliff was never there.
- 8 of 12
- Heavy-load seasons above .500
- 787
- Weather PPDs, 22 seasons
- -1.1 pp
- In 20-in-18-day windows
- 24-10
- 2022 Guardians in Sept-Oct
There is a story fans tell in September, and managers let them. The team is limping. The bullpen is fried. The rotation is on fumes. And somebody, somewhere, points at April - at a rained-out Wednesday in Cleveland, at a snowed-out Sunday in Chicago - and says the schedule caught up with them. It is a satisfying story. It is not the story the data tells.
Every September, fans blame the doubleheaders.
Ask any Mets fan about 2007. Any Tigers fan about 2018. Any Cardinals fan about 2020. The narrative is fluent: a wet April piles up postponements, the make-up games get stacked into split doubleheaders in August, the pitching staff runs out of rest, and by the last weekend the standings tell you a team that should have played 90 games in 90 days played 100 in 88 and paid for it.
The intuition is clean, mechanical, and easy to see. It is also unsupported by twenty-two seasons of Major League scheduling data.
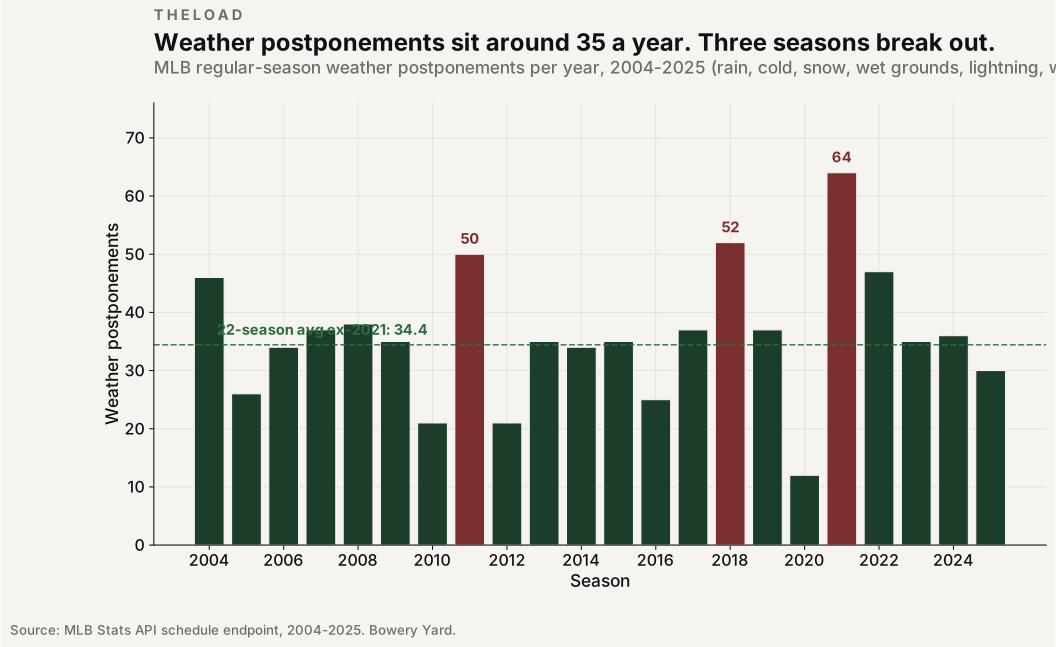
787 weather postponements, 22 seasons, one steady average.
Between 2004 and 2025, Major League Baseball postponed 787 regular-season games for weather - rain, cold, snow, wet grounds, lightning, wind. Two seasons in that window crossed 50: 2011 (50) and 2018 (52). One year outside the window - 2021 (64) - was the first post-COVID season, when the league moved games with less friction than usual and the reported PPD count climbed with it. Every other season since 2004 sat between 21 and 47.
The average is 35.8 postponements per year. The median is 35. The mean from 2004 through 2013 was 34.3. From 2014 through 2025, 37.0 - or 34.5 if you drop 2021. The load has drifted. It has not shifted.
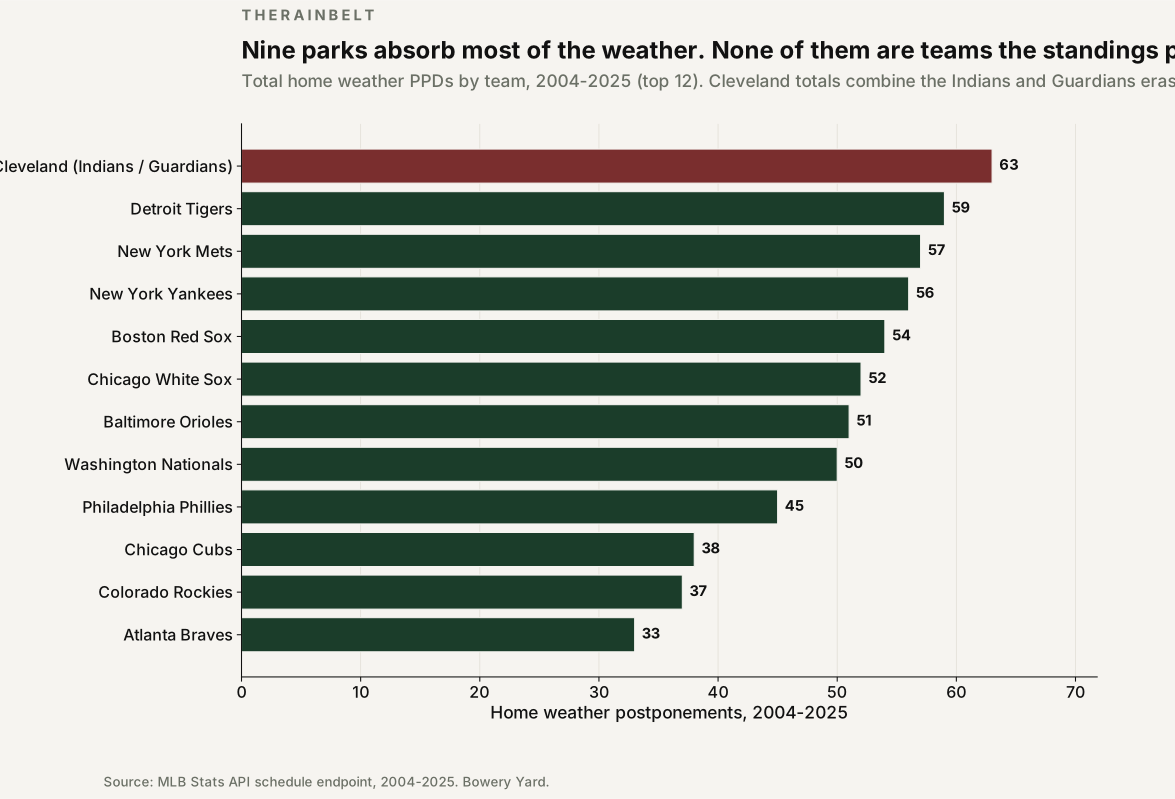
Nine ballparks absorb most of the weather.
Weather is not distributed evenly. Cleveland (63 combined across the Indians and Guardians eras) leads the league, followed by the Tigers (59), Mets (57), Yankees (56), Red Sox (54), White Sox (52), Orioles (51), Nationals (50), and Phillies (45). Nine parks - all north of the Mason-Dixon line or east of the Rockies - account for roughly two-thirds of the league total.
If the schedule tax were competitive - if losing a Wednesday to rain in Cleveland cost you a September pennant race - the standings would look like a rain map. They do not.
You cannot measure the doubleheader penalty in aggregate.
The make-up doubleheader is where the fan mythology lives. Two games in one day, a bullpen already on fumes, a spot starter dragged up from Triple-A, and - the story goes - a team that will fold under the load.
There is a trap in trying to measure this. In every team-game, one team wins and one loses. Aggregate winning percentage across any category of team-games - Mondays, home games, doubleheaders - is exactly .500 by construction. Between 2004 and 2025, teams played 2,784 team-games in doubleheaders and won exactly 1,392 of them. That is not evidence of anything, because both teams in every DH game are equally under the stress the story blames. The penalty has to be measured against an opponent who is not.
One such asymmetric measurement is available in the schedule data: the zero-rest game the day after a doubleheader. A team playing that spot game is usually facing an opponent that did not play a DH the day before. Between 2004 and 2025, teams in that spot went 599-606 (.497). Teams playing zero-rest games without having come off a DH went .500. A 0.25-point gap, on a sample of 1,205, and the 95% confidence interval comfortably includes zero.
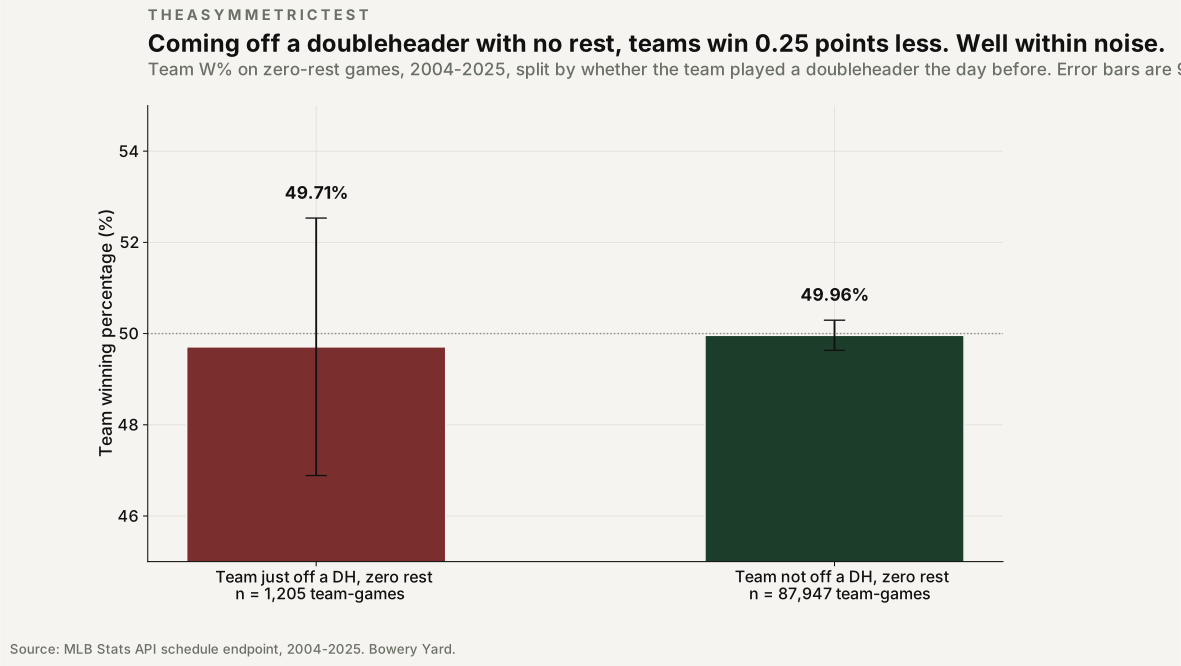
The penalty has to be measured against an opponent who is not under the same stress. In every asymmetric test, it isn't there.
In 103 team-seasons crammed hardest, the W% barely moved.
The other place the mythology hides is the compressed calendar - the July or August stretch when a team forced into make-up doubleheaders ends up playing something like twenty games in eighteen days.
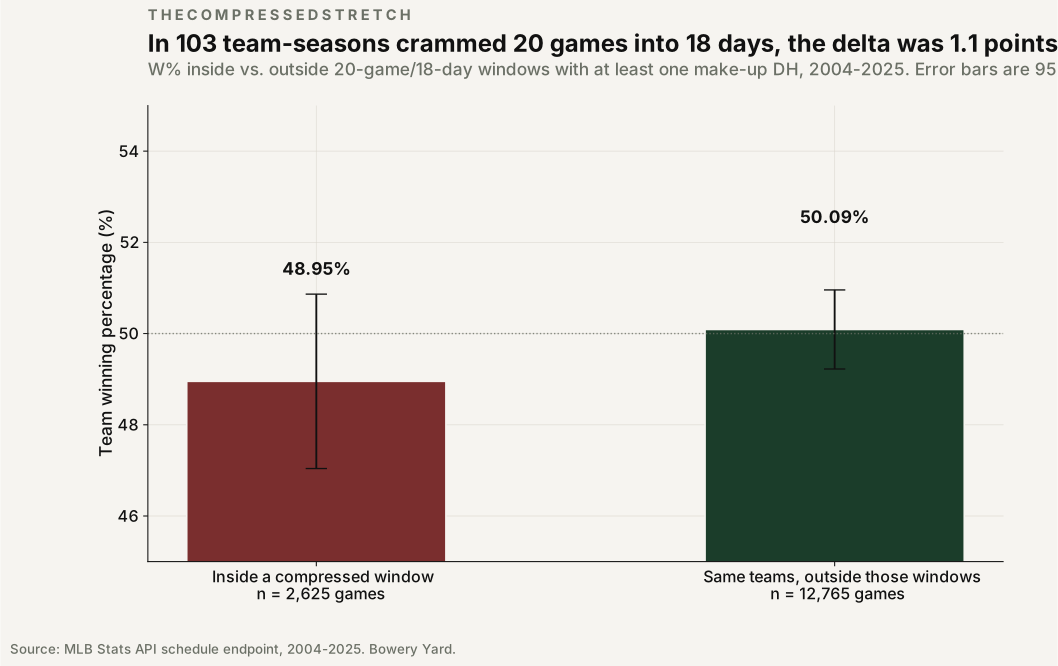
Across 2004-2025, 103 team-seasons contained at least one such stretch: a rolling window of 20 games spanning 18 days or fewer that included at least one make-up doubleheader. Inside those windows, teams went 1,285-1,340 (.489). Outside them, the same teams went 6,394-6,371 (.501).
The delta is 1.1 percentage points, and the 95% confidence interval on it crosses zero comfortably. Even granted at face value - even if the point estimate were the true effect - a full pennant race worth of compressed schedule, played by the teams most exposed to it, is worth about two wins over 162 games. That is not the September collapse. That is a rounding pass on the standings.
Eight of the twelve most-hammered team-seasons finished above .500.
The twelve team-seasons with the most make-up doubleheader games since 2004 read like a control group for the mythology. Eight of the twelve finished above .500. Six won 90 or more games. The 2022 Cleveland Guardians, hit with 9 make-up doubleheader games, went 24-10 in September and October - their best month of the season, and enough to win the AL Central. The 2021 Toronto Blue Jays, with 8 make-up doubleheaders, went 22-9 the same month. The 2019 Yankees, with 7, won 103 games. Even the seasons that missed .500 - the 2021 Mets, the 2004 Pirates - collapsed for reasons that had nothing to do with the calendar.
More make-up doubleheaders, same standings.
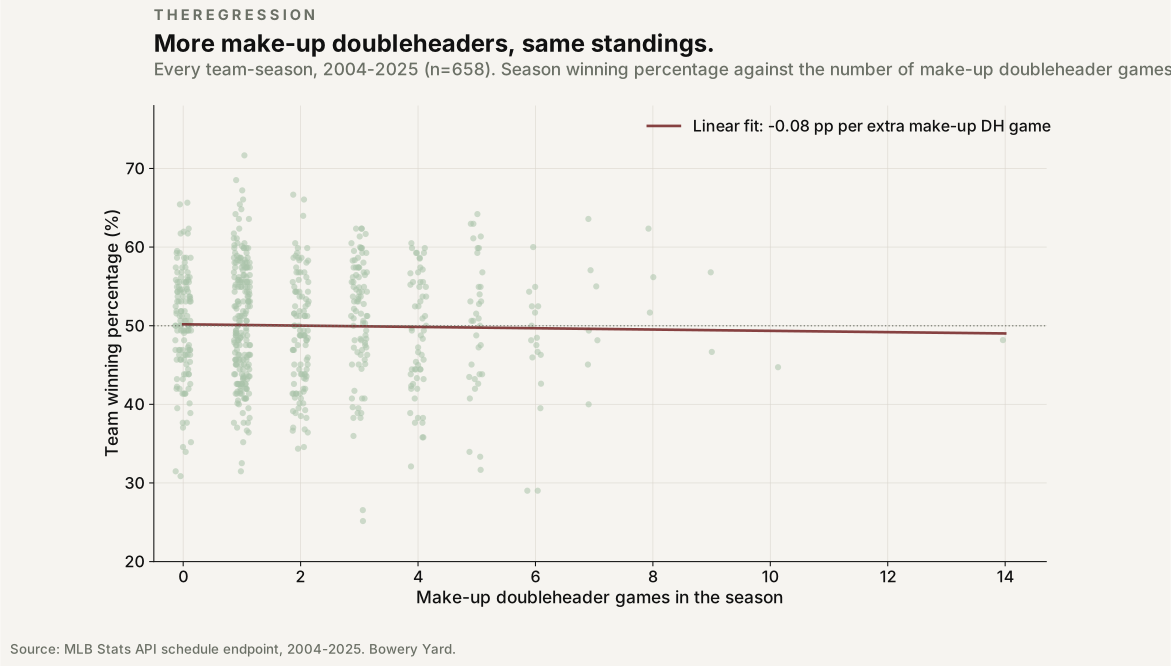
The scatter of every team-season, 2004-2025, against the number of make-up doubleheader games each team played that year, has a slope of -0.08 percentage points. Per extra make-up doubleheader. In the season. Across 658 team-seasons.
A team that gets caught by weather ten times and has ten make-up doubleheaders stacked onto its schedule should expect, on that regression, a winning percentage 0.8 percentage points below the league mean - which for a 162-game season is one and one-third wins. Inside the standard error, that number rounds to zero and stays there.
The weather tax is real. It just isn't on the standings.
The fan intuition is not baseless. Weather is up in the news, PPDs happen every April, doubleheaders are physically hard, no manager takes joy in stacking two games at Progressive Field on a Tuesday in August. Behind the aggregate .500, real starts get skipped, real minor-leaguers get dragged into spot starts, real pitchers throw fifty pitches on zero days rest and end up on the injured list on the road trip after. The weather tax is real for the players it lands on.
It is just not real in the standings. In twenty-two years of MLB scheduling data, no matter how you slice it - by day, by team, by month, by year, by compressed window, by fatigue proxy - the aggregate winning percentage of teams playing under obvious schedule stress is .500, plus or minus a rounding error. The narrative fans and reporters reach for after September collapses does not survive contact with the box scores.
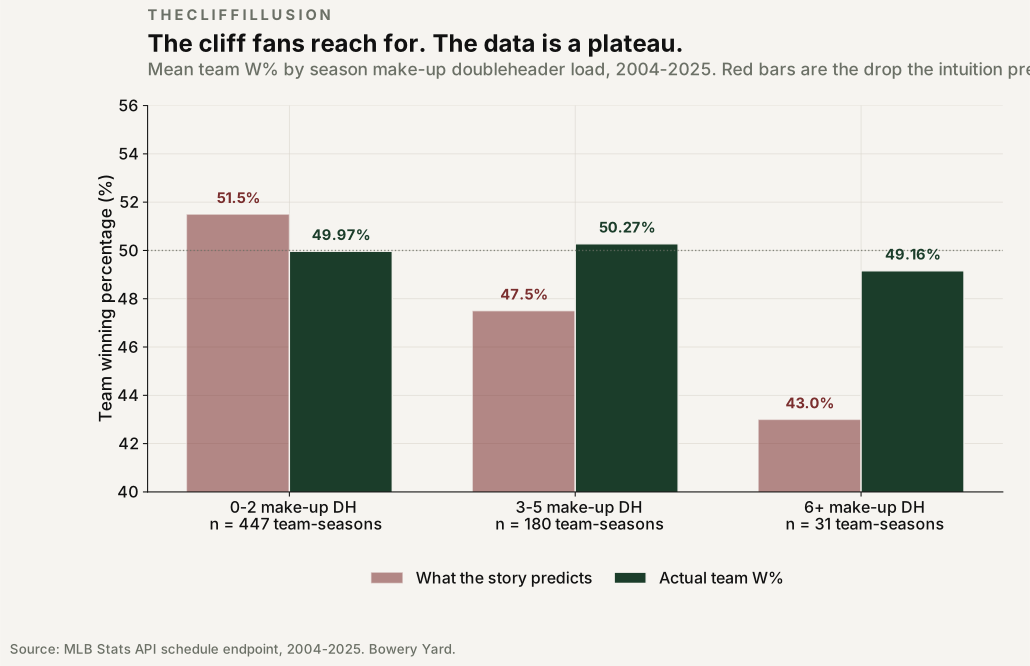
The cliff was never there.